Note: Inspect Element is a browser tool for learning, testing, debugging, and previewing website changes. Edits made inside the inspector are temporary and only affect what you see in your own browser until the page refreshes.
What Does “Inspect Element” Mean on a Mac?
If you have ever looked at a button on a website and wondered, “What magical CSS potion made that thing glow?”, Inspect Element is the answer. On a Mac, Inspect Element lets you open your browser’s developer tools and examine the building blocks of a web page: HTML, CSS, JavaScript behavior, layout boxes, images, fonts, spacing, colors, accessibility labels, and network activity.
In plain English, it is like lifting the hood of a website. You are not breaking into anything, and you are not editing the real website on the internet. You are simply viewing the page structure your browser already downloaded and experimenting with temporary changes. Refresh the page, andpoofyour edits disappear like a cookie near a web developer during deadline week.
This guide explains how to inspect element on Mac using Chrome, Safari, and Firefox. You will learn the fastest keyboard shortcuts, menu paths, right-click methods, practical examples, troubleshooting tips, and real-world ways to use Inspect Element without getting lost in a forest of angle brackets.
Why Use Inspect Element on Mac?
Inspect Element is useful for beginners, designers, marketers, bloggers, developers, students, QA testers, and anyone who has ever stared at a web page and muttered, “Why is this button two pixels off?” It is not just for professional coders wearing mysterious hoodies. It is a practical tool for understanding how websites work.
Common Reasons to Inspect a Web Page
- Check HTML structure: See headings, paragraphs, links, images, buttons, forms, and sections.
- Edit CSS temporarily: Test colors, margins, padding, fonts, borders, and layouts before changing real code.
- Debug layout issues: Find out why an image is too large, a menu is misaligned, or a div is behaving like it drank espresso.
- Preview copy changes: Try a new headline or call-to-action directly on the page.
- Test responsive design: See how a page behaves on different screen sizes.
- Review accessibility clues: Check alt text, labels, contrast hints, and focus behavior.
- Analyze performance: Use network and performance panels to see what loads slowly.
The most important thing to remember is this: Inspect Element changes are temporary. If you edit a heading, delete a sidebar, or turn every button neon green, you are only changing your local view. The actual website remains untouched unless you own the site and update its source files, CMS, or deployed code.
How to Inspect Element on Mac in Google Chrome
Chrome is one of the easiest browsers for inspecting elements on a Mac because Chrome DevTools is built in and ready to use. You do not need to enable a hidden setting first.
Method 1: Right-Click and Choose Inspect
- Open Google Chrome on your Mac.
- Go to the web page you want to examine.
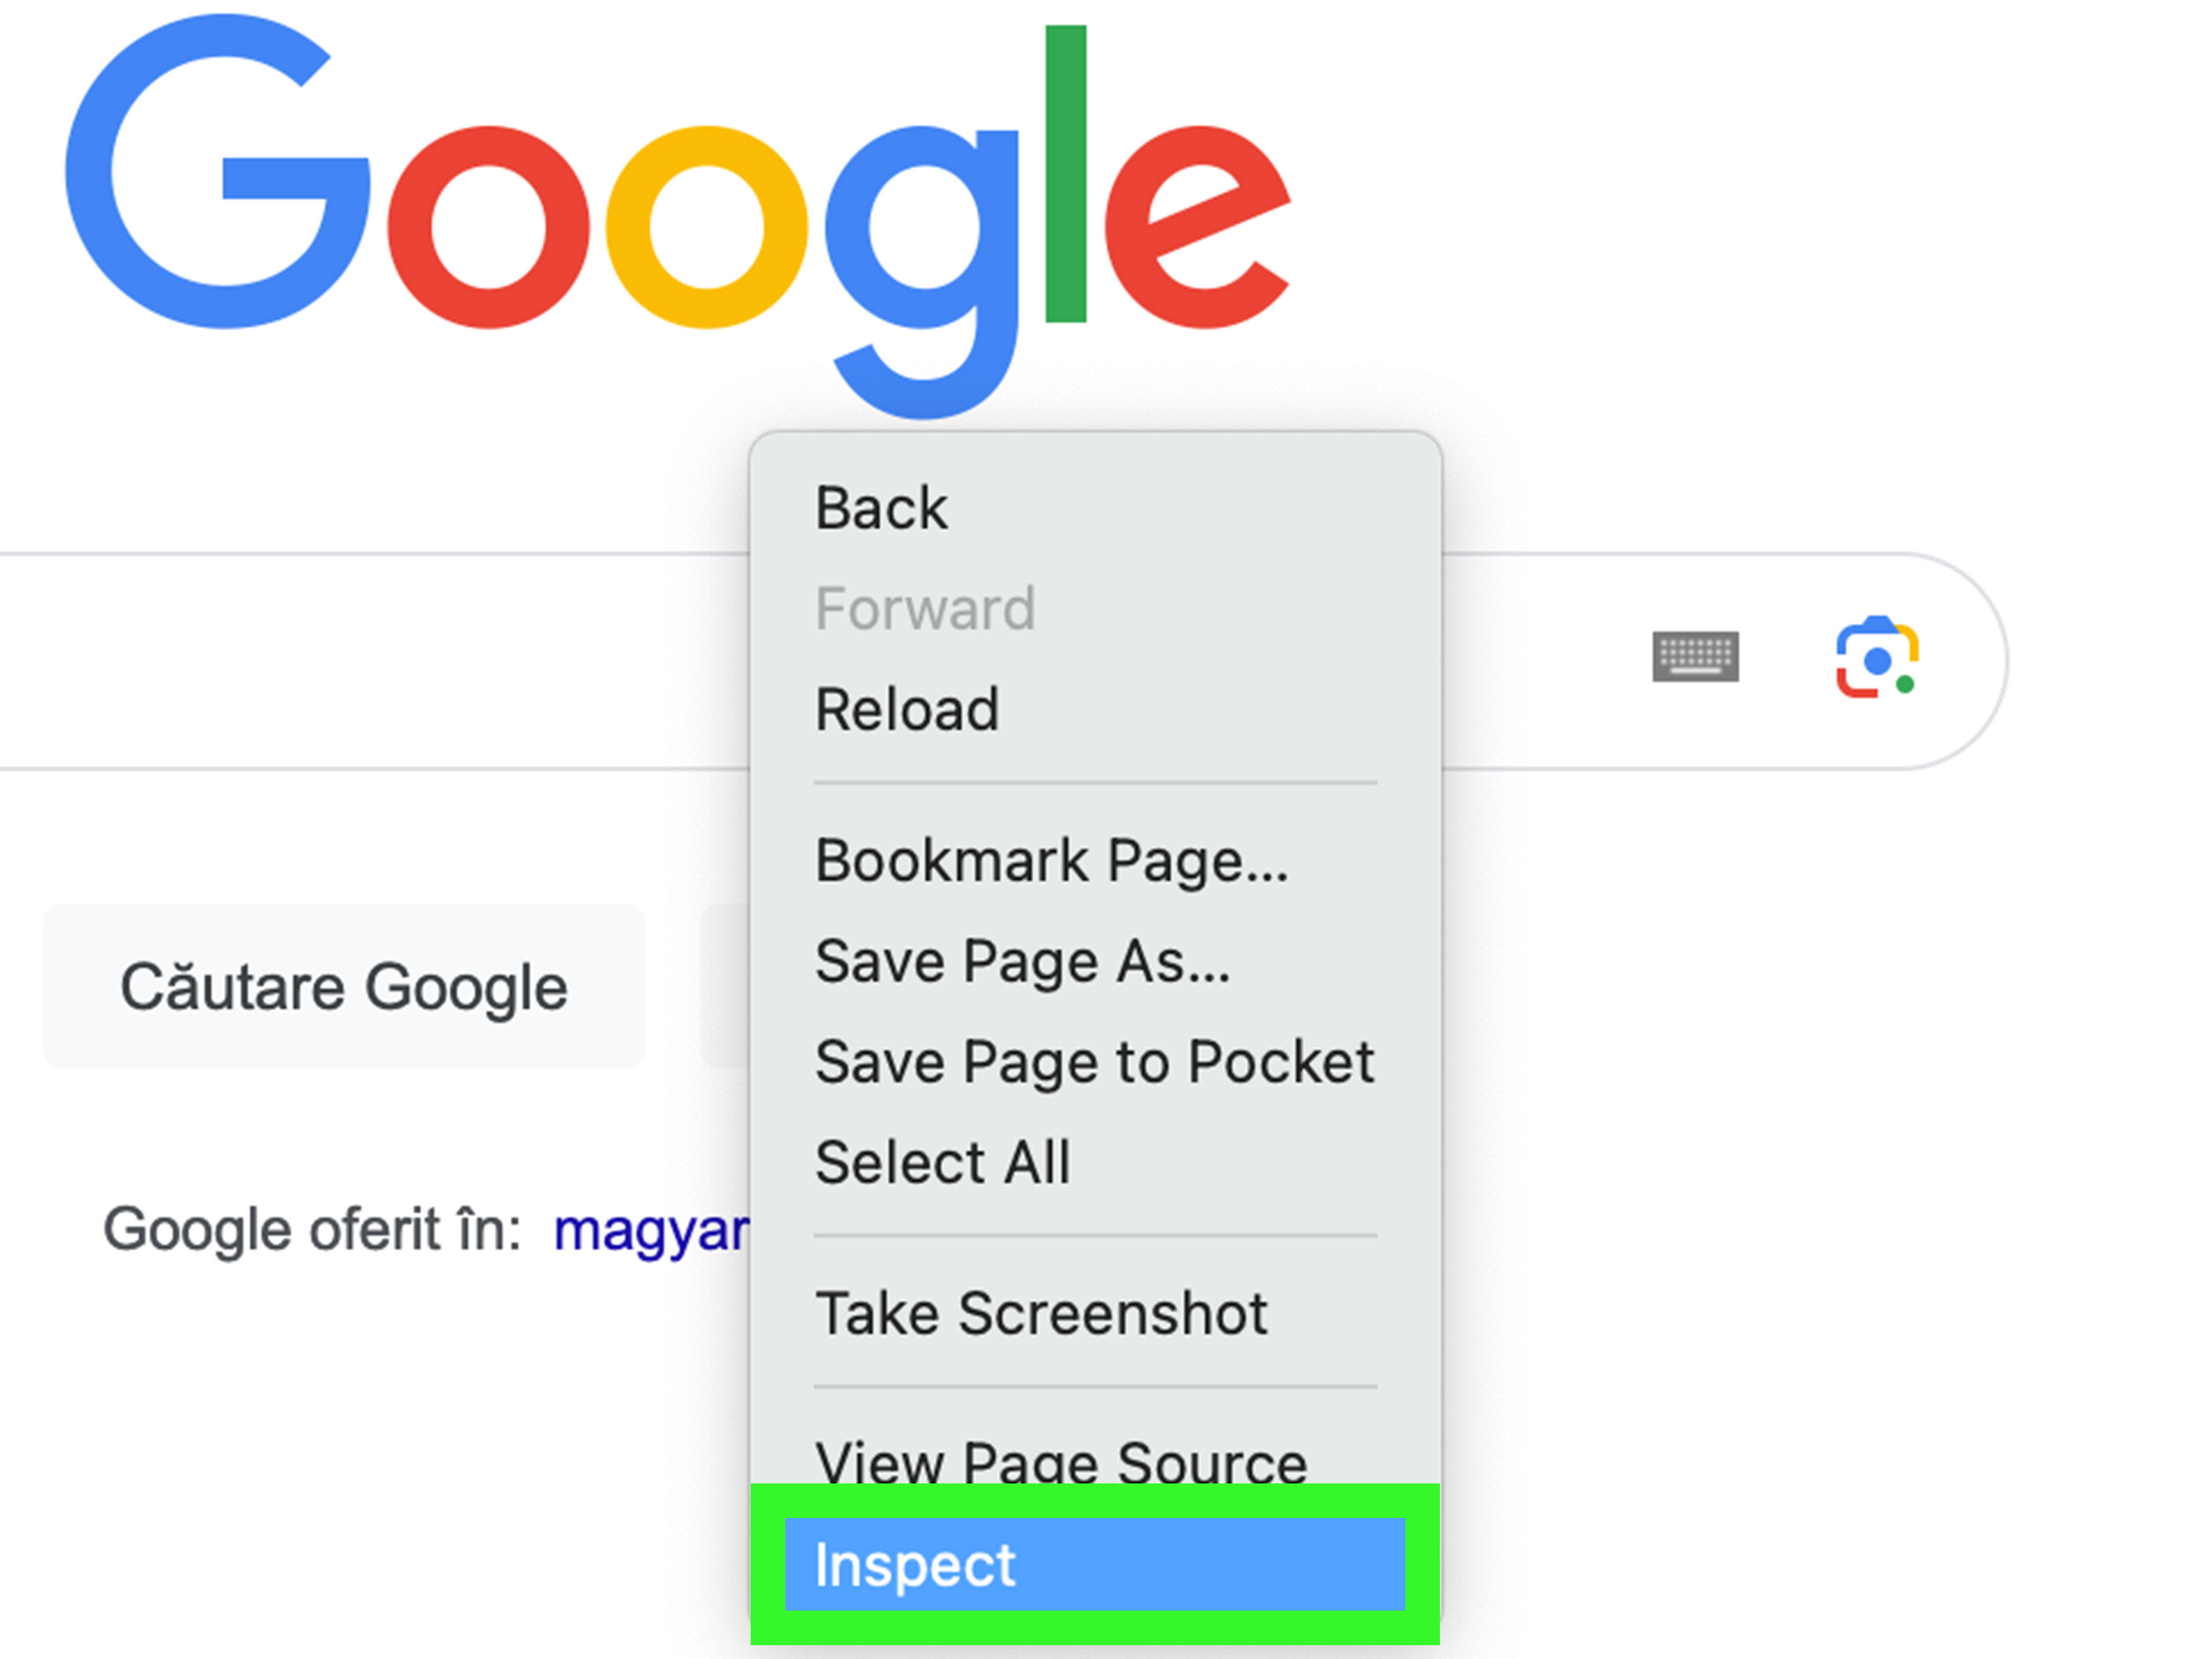
- Right-click the element you want to inspect. If you use a trackpad, click with two fingers.
- Select Inspect.
- Chrome DevTools opens, usually with the Elements panel active.
This is the best method when you want to inspect one specific item, such as a headline, image, button, menu link, or product price. Chrome will highlight the related HTML in the DOM tree and show the CSS rules in the Styles panel.
Method 2: Use the Chrome Inspect Element Shortcut on Mac
The most useful Chrome DevTools shortcuts on Mac are:
- Command + Option + I: Open DevTools using the last active panel.
- Command + Option + C: Open the Elements panel in inspect mode.
- Command + Shift + C: Toggle inspect element mode when DevTools is open.
- Command + Option + J: Open the Console panel.
If your goal is to click an element on the page and instantly jump to its HTML and CSS, use Command + Option + C. Your cursor becomes a selector tool. Hover over the page, click the element you care about, and Chrome will point directly to it. It is basically GPS for HTML.
Method 3: Open DevTools from the Chrome Menu
- Click the three-dot menu in the top-right corner of Chrome.
- Choose More Tools.
- Select Developer Tools.
This opens Chrome DevTools even if you do not right-click a page element. From there, click the element picker icon in the top-left corner of DevTools, then click anything on the page to inspect it.
What You Can Do in Chrome DevTools
Once Chrome DevTools is open, the Elements panel shows the page’s HTML structure. The Styles tab shows CSS rules. You can uncheck CSS properties, edit values, add new rules, and instantly see how the page changes.
For example, imagine a button looks too small. Inspect it, find a rule like padding: 8px 12px;, and temporarily change it to padding: 14px 22px;. The button grows immediately. If it now looks better, you have a clear idea of what to update in your real stylesheet.
Chrome also includes Device Mode, which helps you preview responsive layouts. Open DevTools and press Command + Shift + M to toggle the device toolbar. You can test different viewport widths, rotate simulated screens, and check whether your layout behaves nicely or throws a dramatic tantrum on mobile.
How to Inspect Element on Mac in Safari
Safari is slightly different from Chrome because you may need to enable developer features first. Once enabled, Safari’s Web Inspector is powerful, clean, and especially useful when testing how a website behaves in Apple’s browser environment.
Step 1: Enable Safari Developer Tools
- Open Safari on your Mac.
- Click Safari in the menu bar.
- Choose Settings.
- Click the Advanced tab.
- Enable Show features for web developers. On some older Safari versions, this may appear as Show Develop menu in menu bar.
After this, you should see Develop in the Safari menu bar. Congratulations: you have unlocked the secret developer door. No dragon, no password, just one checkbox.
Method 1: Right-Click and Choose Inspect Element
- Open the page you want to inspect in Safari.
- Right-click the element. On a Mac trackpad, use a two-finger click.
- Select Inspect Element.
- Safari Web Inspector opens and highlights the selected page element.
This method is perfect for quickly checking the HTML and CSS behind a visible part of the page. Safari displays the markup tree and style information so you can inspect layout, spacing, selectors, and active CSS rules.
Method 2: Use the Safari Web Inspector Shortcut
To open Safari Web Inspector on Mac, press:
- Command + Option + I: Open Web Inspector.
You can also go to Develop > Show Web Inspector from the menu bar. If you do not see the Develop menu, return to Safari Settings and make sure developer features are enabled.
Using Safari Responsive Design Mode
Safari also includes Responsive Design Mode, which helps you preview a web page at different widths, heights, pixel ratios, orientations, and device-like views. To open it, choose Develop > Enter Responsive Design Mode.
This is especially useful when testing a website for users on iPhone, iPad, or different Mac screen sizes. While no desktop simulation is a perfect replacement for testing on a real device, Safari’s responsive tools are helpful for catching layout issues early.
When Safari Web Inspector Is Especially Useful
Use Safari Web Inspector when a layout looks fine in Chrome but strange in Safari. Browser differences happen. A CSS feature, font rendering detail, video behavior, or form style may not appear exactly the same everywhere. Safari inspection helps you see what Safari is actually applying, instead of guessing and blaming the nearest innocent semicolon.
How to Inspect Element on Mac in Firefox
Firefox includes excellent developer tools, and its Inspector is especially friendly for examining HTML, CSS, box model spacing, fonts, grid layouts, and accessibility details. If Chrome DevTools feels like a spaceship dashboard, Firefox often feels like a well-organized workshop.
Method 1: Right-Click and Choose Inspect
- Open Firefox on your Mac.
- Visit the web page you want to inspect.
- Right-click the element you want to examine.
- Select Inspect or Inspect Element.
- Firefox opens Developer Tools with the Inspector panel active.
The selected element appears in the HTML pane, and CSS rules appear nearby. You can expand parent and child elements, edit attributes, test style changes, and search the markup.
Method 2: Use the Firefox Inspect Element Shortcut on Mac
Useful Firefox Developer Tools shortcuts on Mac include:
- Command + Option + I: Open Firefox Developer Tools.
- Command + Option + M: Toggle Responsive Design Mode.
- Command + F: Search within the Inspector when the markup pane is active.
Firefox also lets you search markup by text, CSS selector, or XPath. For example, typing .main-nav can help you find a navigation element by class, while typing #signup can locate an element with a specific ID.
What Makes Firefox Inspector Useful?
Firefox is loved by many developers because its layout tools are practical and visual. The box model view makes it easier to understand margin, border, padding, and content size. Grid and flexbox tools are also helpful when a layout refuses to line up neatly, like socks in a laundry basket.
For example, if a card layout has uneven spacing, inspect one card, check the Rules and Layout panels, and compare margins or grid settings. You may find that one card has an extra class, a different image size, or a CSS rule overriding the layout.
Chrome vs. Safari vs. Firefox: Which Inspector Should You Use?
The best browser for Inspect Element depends on what you are testing. You do not have to choose one forever. In fact, if you build or manage websites, using all three is smart because real visitors use different browsers.
Use Chrome DevTools When…
- You want a popular all-purpose tool with strong performance, network, console, and responsive testing features.
- You work with Google tools, Chromium-based browsers, or modern web apps.
- You need fast access to device simulation and detailed CSS inspection.
Use Safari Web Inspector When…
- You need to test how your website behaves in Safari on macOS.
- You care about Apple device users and want to catch Safari-specific layout issues.
- You are checking responsive behavior for iPhone and iPad-style experiences.
Use Firefox Inspector When…
- You want strong visual layout tools for CSS grid, flexbox, spacing, and box model debugging.
- You need a clean Inspector for editing HTML and CSS.
- You like searching markup with text, selectors, or XPath.
For the most accurate testing, inspect your page in more than one browser. A site can look perfect in Chrome and still have a tiny Safari issue hiding behind the curtains with popcorn.
Practical Examples: What to Try After Opening Inspect Element
Example 1: Change a Headline Temporarily
Right-click a headline and choose Inspect. In the HTML panel, double-click the text between the heading tags and type a new version. This is useful when testing blog titles, landing page headlines, or button copy. Refresh the page to reset it.
Example 2: Test a Button Color
Inspect a button and look for CSS properties such as background-color, color, border, or box-shadow. Click the value and try another color. This helps designers and marketers preview changes without opening a design tool.
Example 3: Find Why Something Has Weird Spacing
Inspect the element and look at margin and padding in the box model. If a section has too much empty space, you may find a large margin-top, padding-bottom, or inherited style from a parent container.
Example 4: Check an Image’s Alt Text
Inspect an image and look for the alt attribute. Descriptive alt text helps accessibility and can support image SEO when used naturally. If the alt attribute is empty on an important image, that may be something to fix in the actual website.
Example 5: Preview a Mobile Layout
In Chrome, open DevTools and press Command + Shift + M. In Firefox, press Command + Option + M. In Safari, use Develop > Enter Responsive Design Mode. Resize the viewport and watch for overlapping text, broken menus, tiny buttons, or images that escape their containers like rebellious pixels.
Troubleshooting: Why Can’t I Inspect Element on Mac?
The Right-Click Menu Does Not Show Inspect
In Safari, developer tools may not be enabled yet. Go to Safari > Settings > Advanced and turn on developer features. In Chrome and Firefox, make sure you are right-clicking on the page content, not on the browser toolbar or address bar.
The Website Blocks Right-Click
Some websites use scripts that interfere with right-click menus. Try opening developer tools with a keyboard shortcut instead. In Chrome or Firefox, press Command + Option + I. In Safari, enable the Develop menu and use Command + Option + I.
Your Changes Disappear After Refreshing
That is normal. Inspect Element edits are temporary. To make permanent changes, you must edit the website’s real files, theme, CMS settings, stylesheet, or application code.
You See Too Much Code and Feel Personally Attacked
Start small. Inspect one visible element, such as a paragraph or button. Look for the highlighted HTML. Then check the CSS rules applied to that element. You do not need to understand the entire page at once. Even experienced developers inspect one suspicious div at a time.
The Shortcut Does Not Work
Check whether another Mac app or system shortcut is using the same key combination. Also make sure the browser window is active. If function keys are involved, your Mac keyboard settings may affect how shortcuts behave.
Best Practices for Using Inspect Element
Inspect Element is powerful, but it works best when used with a clear goal. Before opening developer tools, ask what you are trying to learn. Are you checking spacing? Testing a headline? Finding a CSS class? Debugging a broken mobile menu? A specific question keeps you from wandering through the DOM like a tourist without a map.
- Use it ethically: Inspecting visible code is normal, but do not copy proprietary designs, private assets, or protected content.
- Take notes: If a CSS change works, write down the selector and value so you can update the real code later.
- Compare browsers: Test important pages in Chrome, Safari, and Firefox.
- Refresh often: Temporary edits can pile up and confuse your testing.
- Use responsive tools carefully: Browser simulation is helpful, but real-device testing is still better for final checks.
- Watch inherited styles: A visible style may come from a parent element, a global stylesheet, or a more specific selector.
Experience Notes: What I’ve Learned from Inspecting Elements on Mac
After using Inspect Element on Mac across Chrome, Safari, and Firefox, one lesson becomes obvious: the inspector is not just a developer tool; it is a thinking tool. It helps you ask better questions. Instead of saying, “This page looks wrong,” you can say, “This card has a different margin because this class is overriding the grid rule.” That is a much more useful sentence, and it makes you sound like someone who definitely knows where the semicolon went.
Chrome is usually my first stop because it opens quickly, the keyboard shortcuts are easy to remember, and the Elements panel feels familiar. When I need to test a landing page headline, tweak button padding, or preview a mobile layout, Chrome DevTools gives immediate feedback. The device toolbar is especially handy for quick responsive checks. However, I treat it as a preview, not a final verdict. A simulated mobile viewport can reveal obvious layout problems, but it cannot perfectly reproduce every real phone behavior, browser quirk, or touch interaction.
Safari is the browser I never skip when a site is going live for a general audience. Many Mac, iPhone, and iPad users rely on Safari, so a page that looks good in Chrome still needs a Safari inspection pass. I have seen small differences in font rendering, spacing, sticky elements, form controls, and video behavior show up only after checking Safari. Web Inspector feels a little different at first, especially if you live in Chrome all day, but it is worth learning. Enabling the Develop menu once saves future headaches.
Firefox is my favorite when the problem smells like CSS layout. Its Inspector makes spacing, box model behavior, and layout debugging feel more visual. When a flexbox row refuses to align or a grid layout creates awkward gaps, Firefox often helps me understand the issue faster. The search tools are also useful when hunting for a class, ID, or specific markup pattern buried inside a busy page.
One practical habit that helps: inspect the parent element, not only the visible item. Beginners often click the text or image itself, then wonder why they cannot find the spacing problem. Many layout issues come from the container around the element. If a button looks misplaced, inspect the button, then move up through its parent wrappers. The answer may be hiding one level above, quietly sipping coffee.
Another useful habit is to make one temporary change at a time. Change a margin, observe the result, then undo it or refresh. If you change five properties at once, you may not know which one actually fixed the issue. Inspect Element rewards patience. It is like adjusting a recipe: add salt carefully, unless your goal is soup that tastes like the ocean filed a complaint.
For SEO work, Inspect Element is excellent for checking heading structure, link attributes, image alt text, visible content, and how important page elements appear in the rendered HTML. For content teams, it is also a quick way to test whether a shorter title, stronger call-to-action, or cleaner paragraph break improves the page visually before asking a developer to make the change.
The biggest mindset shift is realizing that Inspect Element is not scary. The code may look intense at first, but you do not need to master every panel immediately. Start with HTML and CSS. Learn how to select an element, read its styles, test a simple edit, and refresh the page. Once that feels comfortable, explore responsive mode, the Console, Network panel, and accessibility tools. Bit by bit, the inspector changes from a wall of symbols into a practical dashboard for understanding the web.
Conclusion
Learning how to inspect element on Mac is one of the fastest ways to understand how websites are built and how design decisions appear in the browser. Chrome, Safari, and Firefox all include strong developer tools, and each browser has its own advantages. Chrome is fast and versatile, Safari is essential for Apple-focused testing, and Firefox is excellent for visual layout inspection.
The easiest way to start is simple: right-click an element and choose Inspect. From there, explore the HTML, review the CSS, test temporary changes, and use responsive tools to see how the page behaves at different screen sizes. You will not break the real website. You will, however, become much better at spotting layout issues, testing design ideas, and understanding what is happening behind the page.
Inspect Element is not just for developers. It is for anyone who works with websites and wants clearer answers than “something looks weird.” With a few shortcuts and a little curiosity, your Mac becomes a compact web analysis labminus the lab coat, unless that is part of your brand.