Note: This article is for educational purposes only and is not financial advice. Elliott Wave analysis can help traders organize market structure, but no wave count guarantees a profitable trade. Always manage risk carefully.
Introduction: Why Elliott Wave Still Fascinates Traders
Elliott Wave analysis is one of those trading tools that can make a chart look like either a treasure map or a spaghetti dinner, depending on who is drawing the lines. At its best, the Elliott Wave Principle gives traders a structured way to read market psychology, identify trend phases, and avoid buying at the exact moment a move is getting tired. At its worst, it becomes a complicated guessing game where every failed prediction is renamed “an alternate count.” Convenient? Yes. Profitable? Not always.
The good news is that Elliott Wave does not have to be mystical. You do not need to name every tiny wiggle on a one-minute chart like you are introducing guests at a wedding. Used correctly, Elliott Wave theory can help you spot probable trend continuation, correction zones, breakout opportunities, and invalidation levels. The real trick is not predicting the future with superhero confidence. The real trick is building a trading framework that says, “If price does this, I act. If price violates that, I step aside.”
This guide breaks down practical Elliott Wave tricks that can improve your trading by making your analysis cleaner, your entries more selective, and your risk management less dramatic. Whether you trade stocks, forex, crypto, ETFs, futures, or options, the goal is the same: use wave structure as a map, not as a crystal ball with a brokerage account.
What Is Elliott Wave Theory?
Elliott Wave Theory was developed by Ralph Nelson Elliott in the 1930s. The basic idea is that financial markets move in repeating wave patterns driven by crowd psychology. Instead of moving randomly from point A to point B, markets often advance and correct in recognizable structures.
The Classic 5-3 Pattern
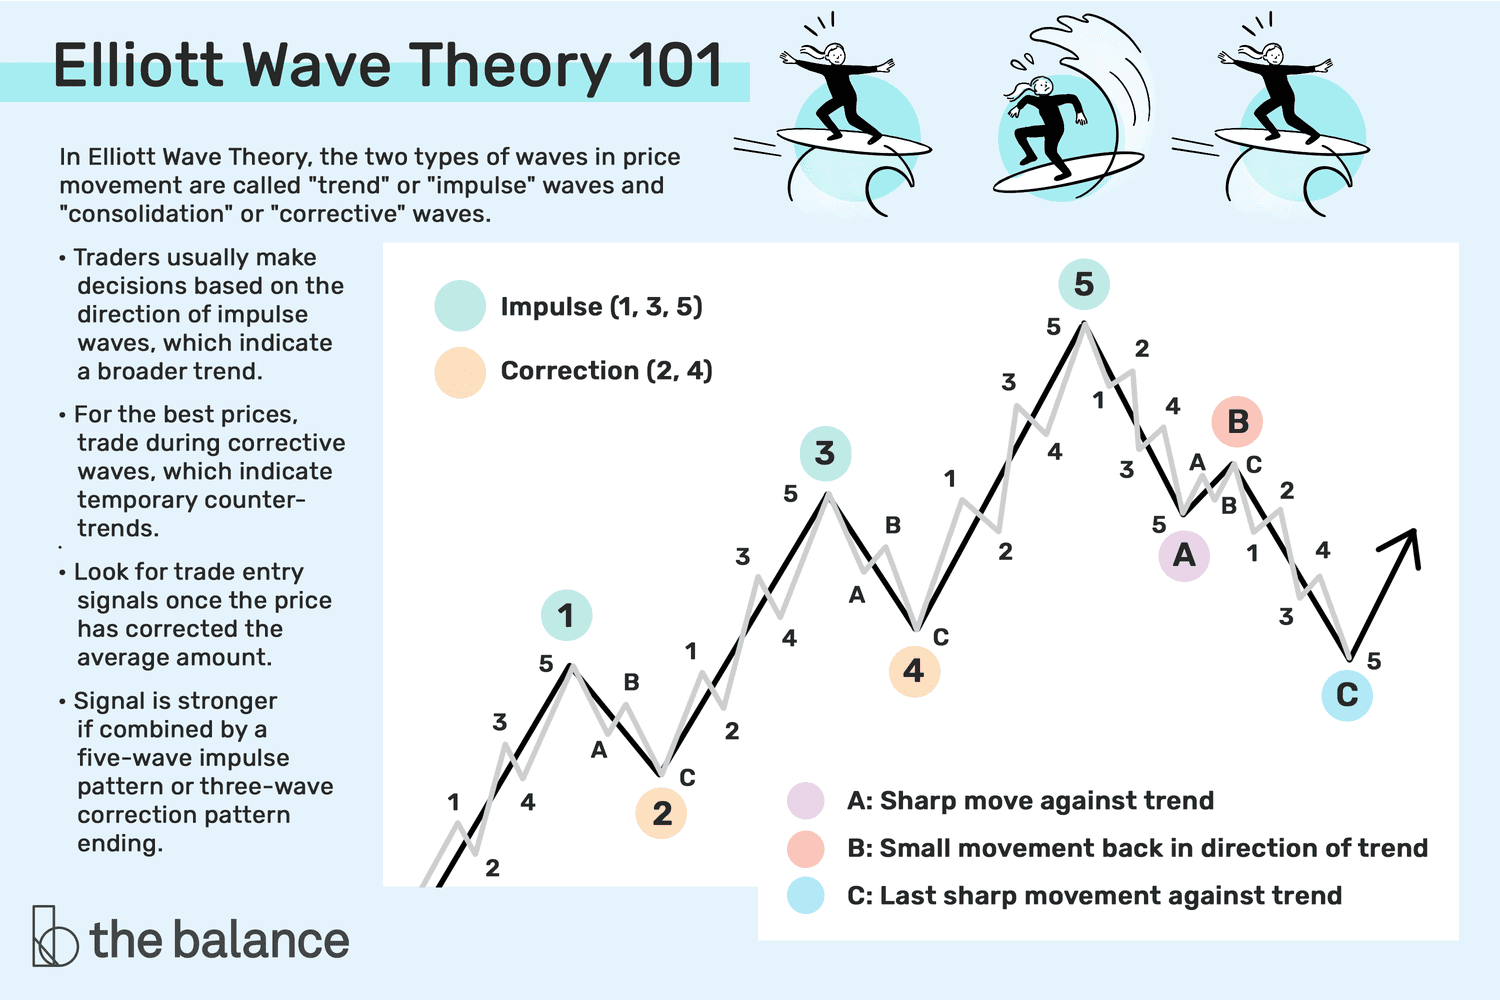
The most common Elliott Wave structure is the 5-3 pattern. In a bullish trend, price advances in five waves, labeled 1, 2, 3, 4, and 5. Waves 1, 3, and 5 move in the direction of the larger trend, while waves 2 and 4 are pullbacks. After the five-wave move is complete, the market often corrects in three waves, labeled A, B, and C.
In a bearish trend, the same concept works in reverse. Five waves may move downward, followed by a three-wave correction upward. This fractal nature means the same pattern can appear on monthly charts, daily charts, hourly charts, and even very short-term charts. That flexibility is useful, but it is also where traders get into trouble. If you stare at a chart long enough, almost anything can look like a wave count. That is why rules matter.
The Three Elliott Wave Rules You Should Never Ignore
Before using any advanced Elliott Wave tricks, traders need to respect the three core rules of an impulse wave. These are not friendly suggestions. They are the bouncers at the door.
Rule 1: Wave 2 Cannot Retrace More Than 100% of Wave 1
If you label a move as Wave 1 and then the next pullback completely erases that move, your count is invalid. Wave 2 can be deep, annoying, and emotionally rude, but it cannot move beyond the start of Wave 1.
Rule 2: Wave 3 Cannot Be the Shortest Impulse Wave
Wave 3 is often the strongest and most energetic wave because broader market participation usually increases during this phase. It does not always have to be the longest, but it cannot be the shortest among Waves 1, 3, and 5.
Rule 3: Wave 4 Should Not Overlap Wave 1 Territory
In a standard impulse wave, Wave 4 should not move into the price territory of Wave 1. There are exceptions in diagonal patterns, but beginners should treat overlap as a warning sign. When the count starts needing too many exceptions, it may be time to delete the lines and take a walk.
Elliott Wave Tricks That Will Improve Your Trading
1. Start With the Higher Time Frame
One of the simplest Elliott Wave tricks is also one of the most ignored: begin with the higher time frame. If you trade the 1-hour chart, first check the daily chart. If you trade the daily chart, look at the weekly chart. The higher time frame often reveals whether you are trading with the broader trend or trying to surf against a tsunami.
For example, a small five-wave rally on a 15-minute chart may look bullish, but if the daily chart shows a larger corrective bounce inside a downtrend, that rally may be only Wave B of a larger A-B-C correction. In plain English: what looks like a rocket ship on the small chart might be a paper airplane on the big chart.
A good habit is to label the higher-time-frame trend first, then use the lower time frame only to refine entries. This keeps you from treating every tiny breakout as the beginning of a historic market event.
2. Trade the Cleanest Wave, Not Every Wave
Many traders try to trade every part of an Elliott Wave sequence. That is like trying to eat every item at a buffet just because it exists. The better approach is to focus on the highest-probability wave setups.
Wave 3 is often the most attractive trading opportunity because it tends to be strong, directional, and supported by growing momentum. Wave C can also offer useful opportunities during corrections, especially when it breaks down from a completed Wave B rally. However, Wave 5 can be tricky because momentum may weaken even as price makes a new high. Chasing Wave 5 without confirmation is how traders end up buying the confetti after the parade has already passed.
3. Use Fibonacci Retracements as Zones, Not Magic Lines
Elliott Wave traders often use Fibonacci retracement levels to estimate where corrections might end. Common retracement areas include 38.2%, 50%, and 61.8%. Wave 2 often retraces deeply, while Wave 4 is frequently shallower, although markets enjoy humiliating overly confident assumptions.
The trick is to treat Fibonacci levels as zones rather than exact turning points. If a stock rallies from $100 to $120, a 50% retracement points near $110. But that does not mean price must reverse at exactly $110. A more realistic trading plan might watch the $108 to $112 area for support, bullish candles, momentum improvement, or a break of a short-term downtrend line.
Fibonacci works best when it aligns with other evidence: prior support, moving averages, trend channels, volume behavior, or a completed smaller wave pattern. A lonely Fibonacci line on a chart is not a trade setup. It is just a line hoping for friends.
4. Use Invalidation Before Prediction
One of the most powerful Elliott Wave tricks is to define where your count is wrong before deciding where price might go. This one habit can transform Elliott Wave from a storytelling tool into a risk-management tool.
Suppose you believe a market has completed Wave 1 and is now pulling back in Wave 2. The start of Wave 1 becomes your major invalidation level. If price breaks below that level in a bullish count, the setup is no longer valid. You do not need to debate with the chart, write an emotional poem, or average down until your trading account files a complaint. You simply accept that the count failed.
Good traders are not right all the time. They are wrong efficiently.
5. Watch for Alternation Between Waves 2 and 4
The guideline of alternation says that Wave 2 and Wave 4 often differ in shape, depth, or complexity. If Wave 2 is a sharp, deep correction, Wave 4 may be more sideways and shallow. If Wave 2 is sideways and complex, Wave 4 may be sharper.
This is not a hard rule, but it is a useful expectation. It helps traders avoid assuming that every correction will look exactly like the previous one. Markets have personalities, and some of them are very committed to being difficult.
For practical trading, alternation can help with patience. If Wave 2 was a fast drop, do not be surprised if Wave 4 drifts sideways for longer than expected. Instead of forcing a trade, wait for the correction to mature and look for signs that the next impulse is beginning.
6. Confirm the Count With Momentum Indicators
Elliott Wave analysis becomes more useful when combined with momentum tools such as RSI, MACD, moving averages, or volume. These indicators do not replace wave analysis, but they can help confirm or challenge your interpretation.
For example, Wave 3 often shows strong momentum. If you label a move as Wave 3 but RSI is weak, volume is shrinking, and price is struggling under resistance, your count may be too optimistic. Meanwhile, Wave 5 sometimes creates a new price high while momentum fails to confirm, forming bearish divergence. That can warn traders that the trend is maturing.
Think of indicators as your chart’s second opinion. Sometimes Elliott Wave says, “This is bullish,” and momentum replies, “Are we looking at the same chart?” Listen to both.
7. Build a Primary Count and an Alternate Count
A professional Elliott Wave trader rarely relies on only one count. Markets are uncertain, and wave interpretation is partly subjective. A primary count represents your main expectation. An alternate count tells you what else may be happening if price does not behave as expected.
For example, your primary count may suggest that price is starting Wave 3 higher. Your alternate count may suggest that price is still completing a larger Wave B correction before another decline. The difference matters because it changes your entry, stop, target, and position size.
The trick is not to create ten alternate counts until your chart looks like a conspiracy board. Keep it simple: one primary count, one reasonable alternate count, and clear invalidation levels for both.
8. Avoid Forcing Counts in Choppy Markets
Elliott Wave works best in markets with clear directional movement. It becomes far less reliable in messy, overlapping, low-volume chop. During these periods, traders often force labels onto random movement because they want a trade.
When price is trapped between support and resistance, wave counts can multiply like rabbits in spring. Is it a triangle? A flat? A double zigzag? A failed fifth? A sandwich? Nobody knows. In these conditions, the best Elliott Wave trick is restraint. Wait for a breakout, a failed breakout, or a cleaner structure.
Not trading is not laziness. Sometimes it is strategy wearing comfortable shoes.
9. Use Trend Channels to Frame Waves
Trend channels can make Elliott Wave counts easier to manage. In an uptrend, draw a channel using the lows of Waves 2 and 4, then project a parallel line near the high of Wave 3. This can help estimate where Wave 5 may encounter resistance.
Channels also help identify when the structure is changing. If price breaks the channel after a completed five-wave advance, it may signal that the market is entering an A-B-C correction. The channel break does not guarantee a reversal, but it gives traders a reason to reduce exposure, tighten stops, or wait for a new setup.
10. Do Not Use Elliott Wave Without Risk Management
This may be the least glamorous trick, but it is the most important. Elliott Wave analysis should never be used as permission to ignore stops, position sizing, or portfolio risk. A beautiful wave count can still fail. A textbook pattern can still get steamrolled by earnings, inflation data, Federal Reserve comments, geopolitical headlines, or one giant candle that appears as if summoned by your stop-loss order.
Before entering a trade, define your entry, stop, target, invalidation point, and maximum acceptable loss. If the reward-to-risk ratio is poor, skip the trade. A smart trader does not take a bad setup just because the chart has numbers on it.
A Practical Elliott Wave Trading Example
Imagine a stock rises from $50 to $60. You label that move Wave 1. It then pulls back to $55, holding above the $50 starting point. That could be Wave 2. Price then breaks above $60 with strong volume and rising momentum. This may signal the start of Wave 3.
A practical trader might enter after the breakout above $60 or after a smaller pullback that holds above the breakout area. The invalidation level could be below the Wave 2 low at $55, depending on the trader’s time frame and risk tolerance. A projected target might use Fibonacci extensions, prior resistance, or channel resistance.
Now imagine price reaches $72 and begins moving sideways. Momentum cools, but price does not collapse. This could be Wave 4. If Wave 4 stays above Wave 1 territory and forms a clean consolidation, a trader might watch for a Wave 5 breakout. However, if the breakout occurs on weak momentum and RSI divergence appears, the trader may take profits rather than chase.
The lesson is simple: Elliott Wave does not tell you to blindly buy or sell. It helps you create conditional plans.
Common Elliott Wave Mistakes to Avoid
Mistake 1: Counting Every Tiny Move
Overcounting creates confusion. Focus on meaningful swings that match your trading time frame. If you are a swing trader, the 5-minute chart should not control your life.
Mistake 2: Ignoring the Bigger Trend
A bullish count on a small chart may be only a correction in a larger downtrend. Always zoom out before getting excited.
Mistake 3: Moving the Stop Because the Count “Still Looks Possible”
When your invalidation level breaks, the trade idea is wrong. Moving the stop is not analysis. It is bargaining.
Mistake 4: Treating Elliott Wave as a Standalone System
Elliott Wave works better when combined with support and resistance, trend analysis, momentum indicators, volume, and risk management. One tool should not carry the entire trading plan like an overworked intern.
Experience Notes: What Traders Learn From Using Elliott Wave
After spending time with Elliott Wave charts, traders usually learn a few lessons that no textbook explains clearly enough. The first is that the best wave count is often obvious only after the move has happened. That sounds discouraging, but it is actually useful. It teaches humility. Elliott Wave should not be used to announce, “The market must go here.” It should be used to say, “This is the most likely structure, and here is where I am wrong.”
Another real-world lesson is that Wave 2 can test your patience like a slow internet connection during tax season. Many traders identify a promising Wave 1, enter too early, and then get shaken out during a deep Wave 2 retracement. More experienced traders often wait for evidence that Wave 2 is ending. That evidence may include a bullish reversal candle, a break of a short-term correction trendline, support near a Fibonacci zone, or momentum turning upward. Waiting means missing some perfect bottoms, but it also helps avoid buying every falling knife with a fancy label.
Wave 3 is usually where the excitement begins. In many strong trends, Wave 3 feels different. Breakouts hold better, pullbacks become shallower, and news often starts supporting the move after price has already begun advancing. A practical trader does not need to capture the first penny of Wave 3. Catching the middle of the move with controlled risk is often enough. The market does not award bonus points for dramatic entries.
Wave 4 teaches a different lesson: boredom is part of trading. After a strong Wave 3, price may drift sideways, chop around, fake out both bulls and bears, and generally behave like it has nowhere important to be. Traders who expect every correction to be fast often give back profits here. A useful habit is to reduce position size, trail stops, or wait for the consolidation to resolve before acting again.
Wave 5 is where discipline matters most. It can be profitable, but it can also be a trap. By the time Wave 5 appears, social media may be excited, headlines may be glowing, and late buyers may be rushing in. At the same time, momentum may be fading beneath the surface. Experienced traders often use Wave 5 to scale out, tighten stops, or watch for divergence instead of becoming emotionally attached to one more breakout.
The biggest experience-based lesson is that Elliott Wave is not about being clever. It is about being organized. A simple chart with clean labels, clear invalidation, and realistic targets is more useful than a masterpiece covered in arrows, Roman numerals, Fibonacci grids, and enough colors to qualify as modern art. The trader who survives is not the one with the fanciest count. It is the one who knows when to trade, when to wait, and when to admit the chart has chosen violence.
Conclusion: Make Elliott Wave Practical, Not Perfect
Elliott Wave analysis can improve your trading when you use it as a flexible decision-making framework instead of a prediction machine. The most useful tricks are simple: start with the higher time frame, respect the three impulse rules, use Fibonacci zones carefully, confirm with momentum, prepare an alternate count, and define invalidation before entering a trade.
The goal is not to label every market movement perfectly. The goal is to understand where price may be within a larger trend or correction, then build trades with favorable reward-to-risk. Elliott Wave can help you avoid chasing exhausted moves, buying into weak corrections, or holding a trade after the structure has failed.
In the end, the best Elliott Wave traders are not fortune-tellers. They are disciplined planners. They know that markets move in waves, but trading accounts grow through patience, risk control, and the ability to say, “This count is wrong, and that is okay.” That sentence may not sound exciting, but it can save more money than any magical fifth-wave target ever will.