In SaaS, everybody loves a shiny new feature launch. There is the roadmap reveal, the release note, the celebratory Slack emoji storm, and maybe even a product manager whispering, “This changes everything.” Then reality arrives wearing sensible shoes: users do not adopt the feature just because it exists.
That is why core feature adoption rate became one of the most important product metrics in 2024. It tells teams whether users are actually engaging with the features that deliver the product’s main value. Not logging in. Not clicking around like confused raccoons in a kitchen. Actually using the features that make the product worth paying for.
This benchmark report explains what core feature adoption rate means, what 2024 data suggests is “normal,” why benchmarks vary across industries, and how SaaS teams can improve adoption without simply shouting louder through email campaigns.
What Is Core Feature Adoption Rate?
Core feature adoption rate measures the percentage of active users who habitually use a product’s most important features during a defined period. These are not random buttons, decorative dashboards, or “nice-to-have” tools hidden in a menu maze. Core features are the capabilities that create the product’s promised value.
For a project management tool, core features might include creating tasks, assigning owners, setting deadlines, and tracking status. For an HR platform, they may include payroll processing, benefits administration, employee onboarding, and compliance workflows. For an analytics product, the core action might be building and viewing reports. The key question is simple: Are users adopting the features that make the product matter?
Core Feature Adoption Rate Formula
The standard formula is:
For example, if a SaaS platform has 10,000 monthly active users and 2,450 of them regularly use a core reporting feature, the core feature adoption rate is 24.5%.
The tricky part is defining “adopted.” One click is usually not enough. A user who opens a dashboard once, panics, and escapes to another tab has not adopted the feature. A better definition includes frequency, recency, and meaningful completion of the workflow.
2024 Benchmark Snapshot: What Is a Good Core Feature Adoption Rate?
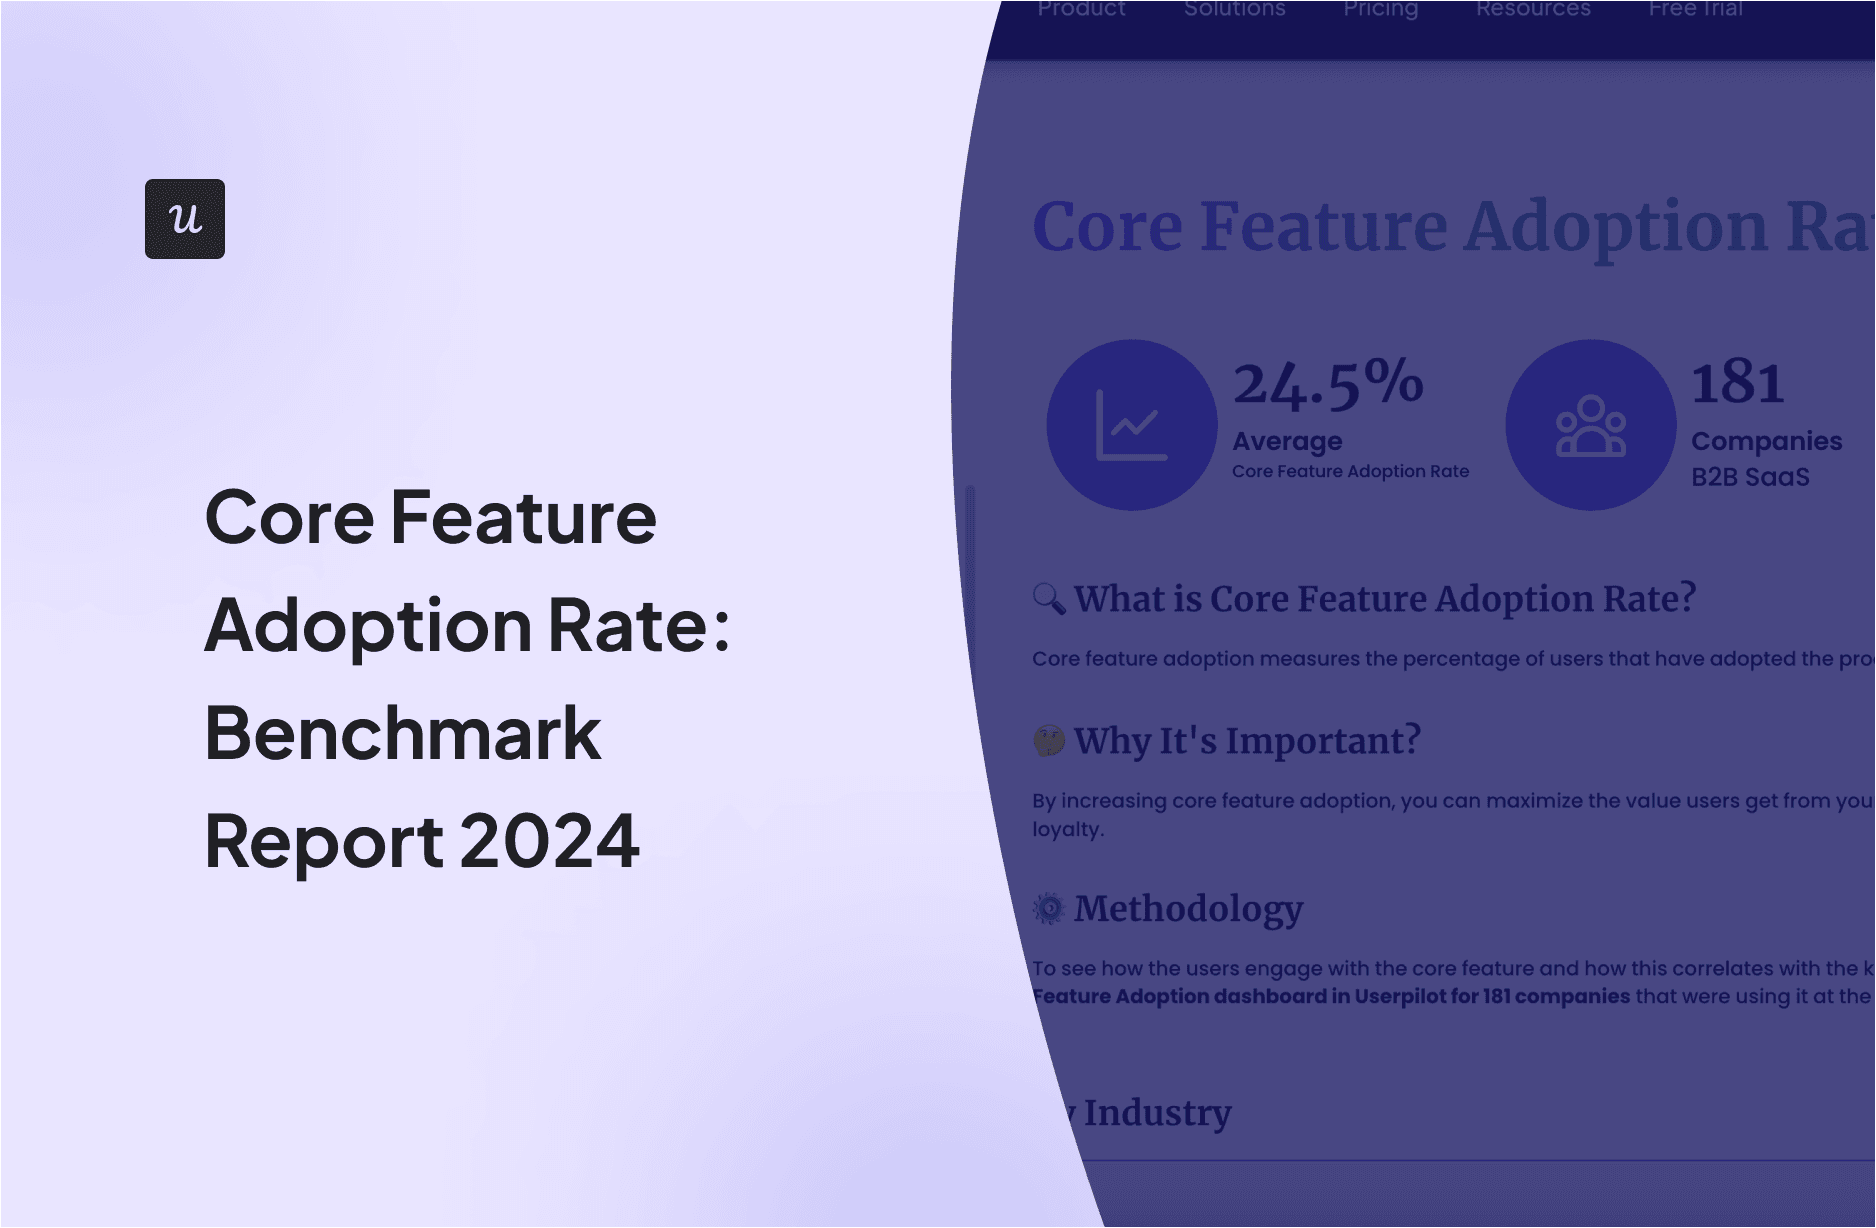
Public 2024 SaaS product metric research suggests that the average core feature adoption rate sits around 24.5%, with a reported median near 16.5% in benchmark discussions focused on SaaS feature adoption. In plain English: many products see only about one in four active users consistently adopt their most important features.
That number may feel low. It may also feel oddly comforting, like discovering everyone else also has 47 browser tabs open. But benchmarks should be used as context, not commandments. A 15% adoption rate might be healthy for an advanced enterprise automation feature used by power users. The same 15% would be alarming for a basic invoice creation tool in accounting software.
Pendo’s benchmark data frames feature adoption differently, looking at the percentage of features that generate most click volume. In that model, best-in-class products report a feature adoption benchmark around 15.6%. This difference matters because every benchmark depends on how adoption is defined. Comparing numbers without comparing definitions is how dashboards become very confident nonsense.
Why Benchmarks Vary So Much by Industry
Core feature adoption rate is highly sensitive to category, product complexity, buyer intent, and daily workflow relevance. HR products, for example, often show stronger adoption because their core workflows are mandatory. People need payroll, benefits, hiring forms, compliance records, and time-off management. Nobody casually “forgets” payroll unless they enjoy office chaos.
In 2024 benchmark summaries, HR companies were reported to have one of the highest core feature adoption rates, around 31%. FinTech and insurance products also performed well, with adoption supported by recurring high-value tasks such as payments, claims, policies, reporting, and account management.
By contrast, optional features in collaboration, marketing, or social products may naturally see lower adoption. A new messaging feature in a social media product might be a crisis if only 6.9% of users adopt it, while a niche workflow in a business services platform could be successful at a similar level. Context is not a footnote; it is the whole game.
Core Feature Adoption vs. Feature Usage: Do Not Mix Them Up
Feature usage tells you whether people interacted with a feature. Core feature adoption tells you whether the right people use the right feature often enough to receive value. The difference is small in wording and huge in business impact.
Imagine a document collaboration app launches an AI summary tool. In the first week, 40% of users click it once. That looks exciting. Champagne? Maybe not. If only 5% continue using it weekly, the feature had curiosity, not adoption. Product teams should separate launch buzz from sustained behavior.
The Four Layers of Adoption Quality
A stronger adoption analysis looks at four layers:
- Breadth: How many users or accounts tried the feature?
- Depth: Which segments adopted it, and are they the intended users?
- Time-to-adopt: How long does it take users to discover and use the feature?
- Duration: Do users keep using the feature after the novelty fades?
This approach prevents a team from declaring victory after a big launch spike. Spikes are nice. Sustained workflows pay the bills.
Why Core Feature Adoption Rate Matters in 2024
In 2024, SaaS companies faced a more demanding market. Growth was still possible, but buyers expected clearer value, faster onboarding, and better efficiency. Product-led growth remained popular, but “let the product sell itself” only works when the product actually guides users to value. Otherwise, the product is not selling itself. It is standing silently in the corner holding a brochure.
Core feature adoption rate matters because it connects product behavior to business outcomes:
- Retention: Users who adopt core workflows are more likely to return.
- Expansion: Accounts using multiple valuable features are better candidates for upgrades.
- Customer satisfaction: Adoption means users are not merely paying; they are succeeding.
- Roadmap discipline: Low adoption exposes features that may need better onboarding, repositioning, redesign, or retirement.
- Customer success prioritization: Adoption gaps reveal which accounts need help before renewal risk becomes a dramatic quarterly surprise.
Benchmark Metrics to Track Alongside Core Feature Adoption
Core feature adoption rate is powerful, but it should not travel alone. It belongs in a product analytics dashboard with other metrics that explain the full user journey.
1. Activation Rate
Activation rate measures the percentage of users who reach an early “aha moment.” In SaaS benchmark discussions, activation is often tied to the first meaningful experience of product value. If users never activate, they rarely adopt core features later.
2. Time to Value
Time to value measures how quickly new users experience the product’s first meaningful outcome. Pendo’s benchmark model highlights very fast time-to-value among best-in-class products, with top performers reducing the gap between signup and value to a fraction of a day. Translation: great products do not make users assemble value like flat-pack furniture with missing screws.
3. Retention Rate
Retention shows whether users come back over time. Mixpanel’s 2024 benchmark research looked at product usage data from thousands of customers and trillions of anonymous events, emphasizing acquisition, retention, engagement, and marketing performance. Retention is where adoption proves it has staying power.
4. Stickiness
Stickiness is often measured through ratios such as DAU/MAU or WAU/MAU. It tells teams how habit-forming the product is. A product with high adoption but low stickiness may be useful only occasionally. That can be fine, but the business model should reflect it.
5. Product Engagement Score
Some teams combine adoption, growth, and stickiness into a broader engagement score. This helps executives see product health at a glance, although teams should still inspect the underlying metrics. Composite scores are helpful, but they can also hide a gremlin in the machinery.
What Low Core Feature Adoption Really Means
Low adoption does not always mean a feature is bad. Sometimes it means users cannot find it. Sometimes the feature is useful but introduced at the wrong point in the journey. Sometimes onboarding explains what the button does but not why anyone should care. And sometimes, yes, the feature is simply not solving a painful enough problem.
Common causes of low core feature adoption include:
- Poor discovery: Users do not know the feature exists.
- Weak positioning: The value is unclear or too technical.
- Complex workflows: Users abandon the feature before reaching value.
- Bad segmentation: The feature is promoted to users who do not need it.
- Insufficient onboarding: The first-use experience fails to guide users.
- Missing habit loop: Users try the feature once but have no reason to return.
- Product-market mismatch: The feature solves a problem that looks better in a roadmap deck than in real life.
How to Improve Core Feature Adoption Rate
Improving adoption is not about pestering users until they surrender. It is about reducing friction, clarifying value, and guiding users toward meaningful behavior at the right moment.
1. Define Your Core Features Ruthlessly
Start by identifying the few features that directly deliver your product’s main promise. Do not include every feature the team worked hard on. Effort is not the same as customer value, which is rude but useful.
2. Segment Adoption by User Type
Overall adoption rate can mislead. Break adoption down by role, company size, plan type, acquisition channel, lifecycle stage, and account health. A feature may be thriving among admins but invisible to end users. Or it may be popular with small businesses but unused by enterprise accounts.
3. Shorten the Path to the First Successful Use
Look at the steps between feature discovery and completed value. Remove unnecessary settings, simplify empty states, add templates, provide sample data, and guide users with contextual prompts. The goal is not to explain everything. The goal is to help users succeed once, quickly.
4. Use In-App Guidance Carefully
Tooltips, checklists, modals, banners, and walkthroughs can improve adoption when they are relevant. They can also become digital confetti cannons fired directly into the user’s face. Use behavioral triggers, not generic blasts. A user who just imported contacts may be ready for segmentation. A user who has not finished setup probably is not ready for advanced automation.
5. Connect Adoption to Customer Success
For B2B SaaS, feature adoption should feed account health scoring. If an account bought the product for reporting but never builds reports, that is a renewal risk. Customer success teams should receive adoption alerts early enough to help, not after the breakup email arrives wearing a subject line that says “Budget review.”
6. Measure Repeat Usage, Not Just First Click
The first click is interest. The second, third, and fourth meaningful uses are adoption. Define adoption thresholds that match the workflow. For a daily planning feature, weekly use may be too low. For quarterly compliance reporting, monthly use may be perfectly healthy.
Example: Turning a 12% Adoption Rate into a Growth Opportunity
Consider a fictional B2B analytics platform with 20,000 monthly active users. The company launches a new automated reporting feature. After 60 days, only 12% of active users have adopted it. Panic? Not yet. Investigation first.
The team segments the data and discovers that adoption is 28% among admins but only 6% among analysts. Session recordings show that analysts find the feature but abandon it when asked to configure report rules from scratch. Customer interviews reveal the issue: users want templates.
The company adds three default report templates, creates an onboarding checklist for analysts, and triggers an in-app prompt only after users manually export two reports. Within the next quarter, adoption rises from 12% to 23%. Support tickets about reporting decline, and expansion conversations improve because customers now see recurring value.
The lesson is not “templates are magic.” The lesson is that adoption improved because the team diagnosed the right friction point.
2024 Benchmark Takeaways for SaaS Teams
The 2024 benchmark picture is clear: core feature adoption is not automatically high, even in healthy SaaS companies. A reported average around 24.5% suggests that most products still have significant room to help users discover, understand, and repeatedly use key workflows.
However, the benchmark should not become a vanity target. A company should not celebrate 25% adoption if the feature is essential to every user. Nor should it panic over 12% adoption if the feature is designed for a narrow admin segment. The best benchmark is always layered: industry average, feature type, user segment, business model, and historical baseline.
Experience-Based Notes: What Product Teams Learn the Hard Way
In real product work, core feature adoption rate often becomes valuable only after teams stop treating it as a scoreboard and start treating it as a diagnostic tool. The difference is enormous. A scoreboard says, “Adoption is 18%, please look concerned in the meeting.” A diagnostic system says, “Adoption is 18% because new users do not reach the setup step, existing users do not understand the upgrade value, and admins are the only segment seeing the prompt.” One creates anxiety. The other creates a plan.
One common experience across SaaS teams is that launch excitement can distort judgment. Internal teams spend months discussing a feature, so by launch day it feels obvious. Users, however, did not attend those roadmap meetings. They do not know the feature’s backstory, strategic importance, or the heroic debugging that happened at 11:43 p.m. They only know whether the feature helps them right now. This is why in-app context, lifecycle timing, and plain-language value propositions matter so much.
Another practical lesson is that adoption improves when teams study successful users. Many teams obsess over users who fail to adopt, which is useful, but incomplete. The best adopters reveal the natural path to value. What did they do first? Which integrations did they connect? Which templates did they use? Which role invited the rest of the team? When product teams map the behavior of successful adopters, they often find patterns that can be built into onboarding for everyone else.
Customer-facing teams also play a bigger role than dashboards suggest. Sales may know which promise convinced the buyer. Customer success may know which workflow determines renewal. Support may know which step confuses users. Product analytics shows what happened, but frontline conversations often explain why. The healthiest adoption programs combine quantitative product data with qualitative feedback from interviews, tickets, surveys, and customer calls.
A final experience worth noting: not every low-adoption feature deserves saving. This is emotionally inconvenient, especially when the feature consumed months of engineering time and has a beautiful launch graphic. But mature product teams know when to improve, reposition, or retire a feature. Adoption data should inform roadmap courage. Sometimes the best growth decision is not adding another feature; it is making the core workflow so clear, fast, and valuable that users adopt it without needing a treasure map.
Conclusion
Core feature adoption rate is one of the clearest signals of whether a SaaS product is delivering real value. In 2024, benchmark data suggests that average adoption is far from universal, even among active users. That should not discourage product teams. It should focus them.
The winners are not always the companies with the most features. They are the companies that help users adopt the right features, at the right time, with the least friction. Measure adoption by segment, connect it to retention, reduce time to value, and treat low adoption as a clue rather than a catastrophe. Your users do not need more buttons. They need more successful outcomes.
Note: This article is written for web publication and synthesizes public SaaS benchmark trends, product analytics frameworks, and adoption best practices. Publishers should refresh benchmark figures when using proprietary or newly released datasets.