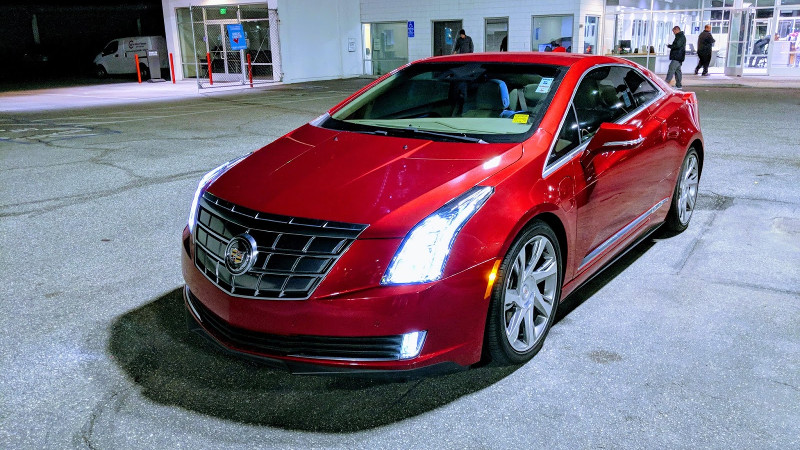
There are two kinds of people who look at a plug-in hybrid Cadillac ELR. The first group sees a sleek luxury coupe with sharp styling, silent electric driving, and enough Cadillac attitude to make a valet stand up straighter. The second group sees a rolling network of sensors, controllers, high-voltage battery data, CAN bus messages, and mysterious numbers whispering through an OBD-II port. This article is for the second groupthough the first group is welcome to stay, especially if they brought coffee.
“OBD-Sniffing A Caddy PHEV” sounds like something you might do in a dim garage with a laptop, a USB-CAN adapter, and a mild disregard for weekend plans. In reality, it is a fascinating look at how modern vehicles communicate internally and how hobbyists, engineers, and curious owners can passively observe useful data from a plug-in hybrid electric vehicle. In this case, the “Caddy” is the Cadillac ELR, a luxury plug-in hybrid coupe built around GM’s Voltec technologythe same general family of engineering that powered the Chevrolet Volt.
The goal is not to “hack” the car in the dramatic movie sense. Nobody is wearing sunglasses indoors while shouting, “I’m in!” The smarter and safer approach is passive sniffing: listening to vehicle network traffic, identifying meaningful signals, and turning raw data into useful displays such as speed, state of charge, energy used, trip distance, or battery behavior. Done responsibly, it is less cyber-villain and more automotive archaeology with a laptop.
What Makes the Cadillac ELR an Interesting PHEV to Sniff?
The Cadillac ELR is a strange and charming machine. It combined luxury-coupe styling with an extended-range electric drivetrain, letting the car drive on battery power for daily trips while keeping a gasoline engine-generator available for longer journeys. That makes it a great candidate for OBD sniffing because it has more going on than a conventional gas car. Instead of simply watching engine RPM, coolant temperature, throttle position, and fuel trims, a PHEV adds high-voltage battery state, electric motor behavior, regenerative braking, charging logic, inverter data, and energy-consumption patterns.
For owners, the factory dashboard often shows only a simplified version of the story. That is understandable. Most drivers do not want a cockpit that looks like mission control had a fight with a spreadsheet. But technically minded drivers may want more: actual battery energy remaining, watt-hours per mile, state of charge in usable units, or real-time efficiency trends. The built-in infotainment system may tell you enough to drive comfortably, but not always enough to satisfy the person who enjoys knowing exactly what the electrons are doing before they clock out for lunch.
This is where OBD-II and CAN bus sniffing come in. The vehicle’s electronic control units exchange messages constantly. Many of those messages are proprietary, undocumented, or at least not available through a basic consumer scan tool. By observing those messages over time and correlating them with real-world behavior, it becomes possible to identify which bytes represent meaningful values.
OBD-II, CAN Bus, and the Difference Between Reading and Sniffing
OBD-II is the standardized diagnostic interface used on modern vehicles. A basic scan tool can request emissions-related information such as diagnostic trouble codes, oxygen-sensor data, engine load, and other standardized parameters. That is the tidy, polite side of diagnostics: the scan tool asks a question, the vehicle answers, and everyone behaves like adults at a neighborhood meeting.
CAN bus sniffing is different. Instead of asking only standardized questions, the tool listens to network traffic already moving between modules. The CAN bus is like a crowded dinner table where the powertrain control module, battery controller, brake controller, instrument cluster, and other electronic modules are all talking. Sniffing means quietly taking notes. Ideally, you do not interrupt, inject messages, or pretend to be a module. You just listen.
Why passive sniffing matters
Passive sniffing is important because vehicles are safety-critical systems. Sending random CAN messages can create unpredictable results, especially in cars with electric drive systems, regenerative braking, high-voltage batteries, and multiple electronic controllers. A responsible OBD-sniffing project focuses on observation, logging, visualization, and learning. It does not attempt to disable safety systems, bypass protections, or control vehicle behavior on public roads.
That responsible mindset also makes the project more useful. When the objective is to build a better dashboard or understand battery behavior, passive data collection is usually enough. You can log messages while charging, driving, braking, accelerating, and switching modes. Over time, patterns emerge. Some signals climb with speed. Others drop as battery energy is consumed. Some values change only during regenerative braking. Others wake up when the gasoline engine starts. The trick is turning the firehose into a readable story.
The Method: From Raw CAN Messages to Useful Data
A typical OBD-sniffing workflow starts with hardware. You need a CAN-capable interface, a safe connection to the vehicle’s diagnostic connector, logging software, and a computer. In the original Cadillac ELR project that inspired this topic, the setup involved reading CAN traffic, collecting data, graphing candidate values, and visually matching those values against real driving behavior. That may sound primitive, but it is surprisingly effective. Sometimes the best diagnostic tool is still the human eyeball, especially when paired with a graph and stubborn curiosity.
The process usually looks like this:
- Connect a CAN interface to the vehicle’s OBD-style connector.
- Record CAN frames during known conditions, such as parked, charging, accelerating, braking, or driving at steady speed.
- Parse message payloads into possible byte, word, and multi-byte values.
- Graph those values over time.
- Compare graph shapes with real-world events.
- Discard values that behave like noise or nonsense.
- Validate promising signals through repeated tests.
- Build a display or logger once signals are trusted.
This is not magic. It is pattern recognition. If a value rises smoothly as the car accelerates and falls as it slows, it might be speed. If a value decreases gradually during electric driving and rises during charging or regenerative braking, it might relate to battery state of charge. If a number increments with distance, it could be odometer or trip data. If it jumps around like a squirrel in a hardware store, it may be a checksum, counter, packed flag field, or something you should politely ignore until later.
Finding State of Charge: The Golden Nugget
For a PHEV like the Cadillac ELR, battery state of charge is one of the most interesting signals. Drivers want to know how much electric energy remains, how efficiently the car is using that energy, and how the battery responds under different conditions. The factory display may present a friendly battery icon or estimated range, but a data-minded owner may want a more technical view.
State of charge can be tricky because manufacturers do not always expose raw battery capacity through standardized OBD-II parameters. A PHEV battery also has buffers. The car may have a gross battery capacity, but only a portion is made available for driving to protect battery life. That means the number shown to the driver, the usable energy window, and the raw battery-management-system value may not be the same thing.
Why SoC is not just “battery percent”
Battery state of charge is influenced by voltage, current, temperature, cell balancing, usable limits, and control strategy. A PHEV does not simply drain from 100 percent to zero like a flashlight. The vehicle protects the battery by reserving top and bottom buffers. It may also change behavior based on drive mode, battery temperature, power demand, and long-term aging. That is why sniffing real data can be so rewarding. It reveals the machine’s behavior beyond the simplified dashboard.
In a practical display, the most useful owner-facing values might include estimated kilowatt-hours remaining, watt-hours per mile, instantaneous power flow, electric miles driven, and total trip energy. Those numbers can help a driver understand whether highway speed, winter temperatures, tire choice, cabin heat, or enthusiastic accelerator use is responsible for range changes. Spoiler: it is often the enthusiastic accelerator. Electrons are fast, but they are not free.
Building a Custom PHEV Dashboard
Once useful CAN signals have been identified, the next step is presentation. Raw hexadecimal data is perfect if you are a microcontroller, but humans generally prefer labels, units, gauges, and graphs. A custom dashboard can turn decoded signals into a live view of vehicle behavior.
For an ELR or similar PHEV, a useful custom dashboard might show:
- Vehicle speed
- Battery state of charge
- Estimated usable energy remaining
- Trip distance
- Energy consumption in Wh/mi
- Regenerative braking energy
- Engine-on and engine-off status
- Charging behavior
- Battery temperature or thermal-management clues
A display like this does more than satisfy curiosity. It can help drivers improve efficiency, spot unusual behavior, and better understand how plug-in hybrid systems balance electric and gasoline operation. It also turns the car into a learning platform. Every commute becomes a rolling data lab, minus the lab coat unless you are really committed to the aesthetic.
What You Can Learn from OBD-Sniffing a Caddy PHEV
OBD sniffing teaches a valuable lesson: modern vehicles are not single machines; they are networks on wheels. The engine, battery, charger, brakes, steering, climate system, and displays are all coordinated by software. In a PHEV, that orchestration is especially complex because the vehicle must decide when to use electric power, when to conserve battery energy, when to start the gasoline engine, and how much regenerative braking to allow.
Energy management becomes visible
One of the most interesting discoveries is how much energy management happens silently. The car may change motor output, engine behavior, or regeneration strategy based on conditions that the driver barely notices. Battery temperature, driver demand, terrain, selected drive mode, and state of charge can all influence what the vehicle does. OBD sniffing lets you watch those decisions indirectly through data.
Regenerative braking becomes measurable
Regenerative braking is another area where data adds clarity. The driver feels deceleration, but the vehicle sees current, voltage, torque requests, and battery acceptance limits. A custom display can help show when regeneration is strong, when friction brakes are likely involved, and when the battery cannot accept as much charge as expected. That is useful for efficient driving and for understanding why the same route may produce different results in summer and winter.
Efficiency stops being a guess
Drivers often estimate efficiency from dashboard range, but range is a prediction. Logged energy use is evidence. By calculating Wh/mi over a route, a driver can compare tires, speeds, weather, cabin heat, terrain, and driving style. The result is not always flattering. The data may politely reveal that the biggest efficiency problem is the organic module between the seat and steering wheel.
Safety, Security, and Common Sense
Any article about OBD sniffing should include a serious safety note. Reading data is one thing; transmitting commands is another. Vehicles rely on electronic messages for safety-critical functions. Unknown CAN injection can cause faults, warning lights, limp modes, or worse. On a plug-in hybrid, the stakes are even higher because high-voltage systems, charging equipment, battery management, and regenerative braking are involved.
Use reputable hardware, make solid connections, fuse experimental circuits where appropriate, and keep wires secured away from pedals, steering components, and airbags. Do not perform distracting laptop work while driving. If live testing is necessary, use a passenger operator, controlled conditions, or logged data for later analysis. The goal is to learn from the car, not convert the footwell into a cable-themed escape room.
Security also matters. Cheap wireless OBD-II dongles can introduce risks, especially if they support insecure Bluetooth pairing or allow raw message transmission. A good rule is simple: do not leave unknown dongles plugged into a vehicle permanently, and do not trust every bargain adapter with access to a car network. The lowest-price tool can become the most expensive mistake if it behaves badly.
Why This Topic Still Matters
The Cadillac ELR may be a niche vehicle, but the lessons from OBD-sniffing it apply broadly. Cars are becoming more electrified, more connected, and more software-defined. PHEVs, EVs, and hybrids all depend on layers of data that owners rarely see. As diagnostics evolve from classic OBD-II toward UDS-based standards and more electrified-vehicle data requirements, the gap between “what the car knows” and “what the driver sees” remains an exciting space.
For enthusiasts, OBD sniffing is a way to understand the machine more deeply. For repair professionals, it supports diagnostics and system knowledge. For engineers, it highlights how vehicle data can be interpreted, visualized, and validated. For writers and curious drivers, it is proof that even a luxury coupe can have a secret life as a data center with leather seats.
Practical Example: A Responsible Sniffing Session
Imagine preparing a safe, passive logging session in a Cadillac ELR. The car is parked, powered on, and connected through a wired CAN interface. The first recording captures the vehicle sitting still. This gives a baseline: messages that change while stationary may represent counters, clocks, module heartbeats, temperatures, or status flags.
Next, the car is charged. Values that rise slowly during charging become candidates for battery energy or state of charge. Then comes a short drive with known events: gentle acceleration, steady speed, regenerative braking, a stop, and perhaps a mode change. The log is marked with timestamps. Back at the desk, the data is parsed into possible integer values and graphed. One value tracks speed almost perfectly. Another steps down as energy is used. Another changes during regenerative braking. Each candidate is tested again on another drive.
Eventually, the useful signals become reliable enough for a small dashboard. The display does not control the car. It simply listens and reports. That is the sweet spot: insight without interference.
Experience Notes: Lessons from OBD-Sniffing a Caddy PHEV
The first real lesson from a project like OBD-sniffing a Caddy PHEV is patience. At first, the CAN bus feels like a slot machine that pays out in hexadecimal. Messages fly by constantly, and most of them make no immediate sense. The temptation is to assume every unknown byte is hiding a glamorous secret. In practice, many bytes are counters, flags, checksums, or values that only make sense when combined with other data. The best approach is to slow down, create controlled test conditions, and compare logs carefully.
A good experience is to start with one target signal rather than trying to decode the whole car. Speed is often the friendliest first target because it has obvious behavior. The car is stopped, the value is stable. The car accelerates, the value rises. The car slows, the value falls. Once you learn how a known signal looks in the data, you become better at recognizing less obvious signals such as battery state of charge or energy consumption. It is like learning a new language by first identifying “hello,” “goodbye,” and “where is the coffee?”
Another experience worth sharing is that graphing is more powerful than staring at logs. Raw CAN frames in a terminal window can make even a determined enthusiast question their life choices. But when the same data is plotted over time, patterns jump out. A smooth ramp, a staircase decline, a repeating pulse, or a value that changes only when braking can reveal meaning quickly. Visual analysis does not replace validation, but it helps you decide where to investigate.
Documentation habits matter too. Keep notes on driving conditions, timestamps, selected modes, battery estimate, outside temperature, and charging state. Without notes, yesterday’s brilliant discovery becomes today’s mystery blob. With notes, you can correlate a data spike with a hard acceleration event, a battery drop with a known route, or a mode change with a specific button press. Good notes are not glamorous, but neither is losing three hours because you forgot whether the car was in Tour or Sport mode.
Hardware reliability is another practical lesson. Loose connectors, poor grounding, cheap adapters, or cables dangling near pedals can ruin data and create unsafe conditions. Build or buy a stable cable, secure it properly, and test everything before driving. If possible, log first and analyze later. Trying to debug software while the vehicle is moving is a terrible user interface, especially when the user also has to steer.
The most satisfying moment comes when a decoded signal becomes genuinely useful. Watching battery energy fall during a commute, seeing regeneration add measurable energy back, or calculating real Wh/mi makes the car feel more transparent. The vehicle stops being a black box and becomes a system you can observe. That does not remove the magic of the ELR; it adds another layer. You still get the sleek Cadillac coupe experience, but now with a backstage pass to the electrons.
The final experience is humility. Automotive engineers design these systems with deep constraints: safety, emissions, durability, drivability, warranty, cost, temperature, and user behavior. OBD sniffing can reveal what the car is doing, but it also reminds you that every simple dashboard icon may represent thousands of engineering decisions. The best projects respect that complexity. Listen carefully, change nothing unnecessarily, and let the data teach you. In other words: sniff politely.
Conclusion
OBD-sniffing a Caddy PHEV is a perfect blend of automotive curiosity, software detective work, and practical electric-driving insight. The Cadillac ELR is especially interesting because its Voltec-based plug-in hybrid system hides a rich world of battery, motor, charging, and energy-management data behind a polished luxury interface. By passively listening to CAN bus traffic, graphing raw values, validating patterns, and building a custom display, an enthusiast can reveal details the factory dashboard leaves out.
The smartest version of this project is careful and respectful. It avoids unsafe message injection, uses reliable hardware, documents test conditions, and focuses on understanding rather than controlling. Done properly, OBD sniffing can help owners learn how their PHEV behaves, improve driving efficiency, and appreciate the engineering behind modern electrified vehicles. It is not just car hacking. It is car listeningand sometimes the car has a lot to say.