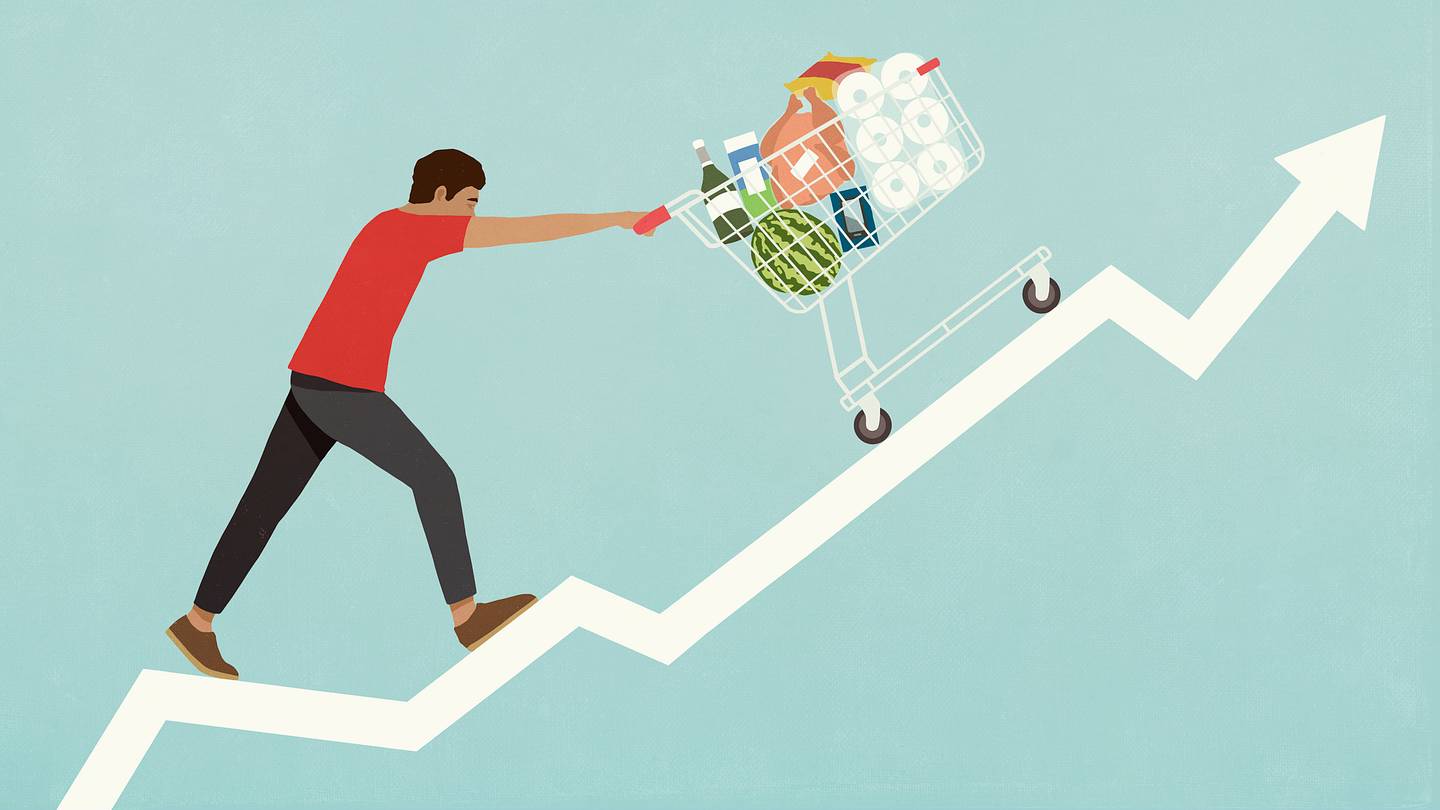
Inflation may have cooled from its post-pandemic peak, but nobody told the grocery receipt, restaurant check, electric bill, or landlord. Across the United States, prices continued rising in 2025, although the pace varied dramatically from one metropolitan area to another.
In some cities, inflation arrived as a sudden short-term jump. In others, prices climbed more steadily throughout the year. Either way, residents faced the same irritating result: a paycheck that seemed to develop a mysterious shrinking problem between direct deposit and Friday night.
A widely circulated 2025 analysis compared 23 major metropolitan statistical areas using Consumer Price Index data. It considered both the change over approximately two months and the change over one year, giving equal importance to recent acceleration and longer-term inflation. Seattle led that particular snapshot, followed by San Diego and Tampa.
However, the ranking should not be confused with a list of America’s most expensive cities. Inflation measures how quickly prices change, not the absolute price level. A relatively affordable city can experience fast inflation, while an expensive city can rank lower because its already-high prices are rising more slowly.
How City Inflation Was Measured
The Consumer Price Index, commonly called the CPI, tracks changes in the prices urban consumers pay for a broad collection of goods and services. Its basket includes shelter, food, transportation, medical care, clothing, utilities, recreation, and other everyday expenses.
For this 23-city comparison, each metro received a ranking based on two measurements:
- The percentage change in CPI from the latest available month to roughly two months earlier.
- The percentage change in CPI from the latest available month to one year earlier.
This approach captures two different experiences. The annual figure shows whether a city has endured persistent price pressure, while the shorter measure reveals whether inflation has recently stepped on the gas. Because some smaller metropolitan CPI reports are published every other month, the latest available observation was not identical for every location.
The 23 Cities Most Affected in This 2025 Snapshot
| Rank | Metropolitan Area | Two-Month CPI Change | One-Year CPI Change |
|---|---|---|---|
| 1 | Seattle-Tacoma-Bellevue, WA | 1.40% | 2.70% |
| 2 | San Diego-Carlsbad, CA | 0.80% | 4.00% |
| 3 | Tampa-St. Petersburg-Clearwater, FL | 1.10% | 3.30% |
| 4 | St. Louis, MO-IL | 1.10% | 2.50% |
| 5 | New York-Newark-Jersey City, NY-NJ-PA | 0.70% | 3.20% |
| 6 | Philadelphia-Camden-Wilmington, PA-NJ-DE-MD | 0.60% | 3.30% |
| 7 | Miami-Fort Lauderdale-West Palm Beach, FL | 0.50% | 3.10% |
| 8 | Riverside-San Bernardino-Ontario, CA | 0.20% | 3.50% |
| 9 | Baltimore-Columbia-Towson, MD | 0.30% | 3.00% |
| 10 | Los Angeles-Long Beach-Anaheim, CA | 0.20% | 3.20% |
| 11 | Minneapolis-St. Paul-Bloomington, MN-WI | 0.70% | 1.80% |
| 12 | Detroit-Warren-Dearborn, MI | 0.90% | 1.30% |
| 13 | Atlanta-Sandy Springs-Roswell, GA | 0.60% | 1.80% |
| 14 | Denver-Aurora-Lakewood, CO | 0.40% | 2.10% |
| 15 | Chicago-Naperville-Elgin, IL-IN-WI | 0.10% | 2.70% |
| 16 | Washington-Arlington-Alexandria, DC-VA-MD-WV | 0.40% | 2.00% |
| 17 | Houston-The Woodlands-Sugar Land, TX | 0.40% | 1.80% |
| 18 | Boston-Cambridge-Newton, MA-NH | -0.30% | 3.20% |
| 19 | San Francisco-Oakland-Hayward, CA | 0.20% | 1.50% |
| 20 | Anchorage, AK | 0.10% | 1.60% |
| 21 | Urban Honolulu, HI | -0.30% | 2.30% |
| 22 | Phoenix-Mesa-Scottsdale, AZ | 0.20% | 0.20% |
| 23 | Dallas-Fort Worth-Arlington, TX | -0.30% | 0.90% |
Why the Highest-Ranked Cities Felt So Much Pressure
1. Seattle-Tacoma-Bellevue, Washington
Seattle reached the top primarily because prices accelerated sharply in the short term. Its two-month CPI increase was the largest in the group, even though its annual rate was closer to the national trend. Housing and energy costs were especially important in a region where many households were already starting from a high cost-of-living baseline.
2. San Diego-Carlsbad, California
San Diego recorded the highest annual increase in the ranking at 4%. That increase landed on top of expensive housing, transportation, utilities, and services. A four-percent rise is inconvenient almost anywhere; in coastal Southern California, it can feel as though the household budget has been tossed into the Pacific without a flotation device.
3. Tampa-St. Petersburg-Clearwater, Florida
Tampa combined strong short-term inflation with a 3.3% annual increase. Rapid population growth, housing demand, insurance expenses, restaurant prices, and service-sector costs all added to the squeeze. Residents who once viewed the region as a lower-cost alternative to South Florida increasingly discovered that affordability can move away without leaving a forwarding address.
4. St. Louis, Missouri-Illinois
St. Louis stood out because of a 1.1% short-term rise, matching Tampa’s recent acceleration. Its annual increase was more moderate, but the quick jump mattered to households buying groceries, paying rent, commuting, or replacing household goods during that period.
5. New York-Newark-Jersey City
New York’s annual CPI increase reached 3.2%. Shelter, dining, transportation, personal services, and other urban necessities were already expensive, so additional inflation amplified an existing affordability challenge. In New York, even a modest percentage increase can translate into a very unmannerly number of dollars.
Coastal Metros Faced a Double Burden
Several coastal areas appeared near the top, including San Diego, Tampa, New York, Philadelphia, Miami, Riverside, Baltimore, and Los Angeles. Their experiences were not identical, but many shared two disadvantages: high housing costs and expensive services.
Philadelphia and Baltimore
Philadelphia posted a 3.3% annual increase, while Baltimore reached 3%. Both metros faced continued shelter and service inflation. Medical care, restaurant meals, insurance, home maintenance, and transportation can keep budgets under pressure even when gasoline or consumer-goods prices temporarily improve.
Miami and Tampa
Florida’s two entries in the top seven reflected more than grocery inflation. Housing demand, property insurance, auto insurance, utilities, and service-sector wages contributed to the broader cost-of-living challenge. Insurance is not always the loudest part of CPI discussions, but Floridians rarely need reminding that it exists.
Riverside and Los Angeles
Riverside experienced a relatively small short-term increase but a sizable 3.5% annual rise. Los Angeles recorded a similar pattern, with only 0.2% over the shorter period but 3.2% across the year. This demonstrates why one month of calmer data does not immediately erase a year of accumulating expenses.
Fast Short-Term Inflation Changed the Middle of the Ranking
Detroit ranked 12th despite having one of the lowest annual inflation rates in the table. Its 0.9% short-term increase pushed it upward. Minneapolis and Atlanta followed a similar pattern: their annual rates were relatively restrained, but recent prices were moving faster.
That distinction matters to consumers. A moderate annual average may sound reassuring in an economic report, yet a sudden jump in groceries, electricity, rent, or gasoline can force an immediate household adjustment. Families do not buy an “annual average” at the supermarket. They buy Tuesday’s eggs at Tuesday’s price.
Denver, Chicago, Washington, and Houston occupied the lower-middle portion of the ranking. These metros experienced inflation, but neither the short-term nor annual measurements placed them among the most severe cases in this particular snapshot.
Why Boston and Honolulu Ranked Lower Than Expected
Boston’s CPI declined 0.3% in the short comparison but remained 3.2% higher than a year earlier. Honolulu showed the same short-term decline with a 2.3% annual increase. Their positions illustrate how a temporary decrease can pull down a composite ranking without making daily life inexpensive.
Boston and Honolulu remain high-cost markets by national standards. This is where the difference between inflation and price level becomes essential. A $100 expense declining to $99.70 has experienced mild deflation, but it is still more expensive than an equivalent item costing $80 elsewhere.
Metro-level estimates also involve smaller samples than national CPI data. Small differences between nearby rankings should therefore be interpreted carefully rather than treated like the final standings of a championship season.
Why Phoenix and Dallas Finished Near the Bottom
Phoenix recorded only a 0.2% annual CPI increase, while Dallas-Fort Worth posted 0.9% and a short-term decline. Those figures placed them at the bottom of this snapshot, but they do not mean residents escaped the cumulative price increases of previous years.
Inflation measures the rate of change from an already elevated starting point. When inflation slows, prices generally do not return to where they were before the surge. They simply rise more slowlyor occasionally dip for a limited period. A grocery bill taking smaller steps uphill is still walking uphill.
What Continued Driving Inflation in 2025?
Shelter remained stubborn
Rent and the estimated rental value of owner-occupied homes carry substantial weight in the CPI. Limited housing supply, construction costs, zoning constraints, population growth, and elevated borrowing costs kept housing affordability under strain in many metropolitan areas.
High mortgage rates also created a lock-in effect. Homeowners with older, lower-rate loans had little incentive to sell, limiting inventory in some markets. For potential buyers, the combination of home prices and financing costs often mattered more than either factor alone.
Eating out became noticeably more expensive
Food prices rose in 2025, but restaurant prices generally increased faster than grocery prices. Dining establishments faced labor, rent, insurance, ingredient, and utility expenses. Those costs appeared on menus in the form of higher prices, smaller portions, extra fees, or the occasional entrée priced as though it came with a small parcel of land.
Egg prices were particularly volatile during the year because of disruptions associated with avian influenza. Even when headline food inflation looked moderate, individual categories could produce much larger shocks.
Utilities and insurance varied by region
Electricity, natural gas, homeowners insurance, and auto insurance placed uneven pressure on different cities. Coastal areas faced property-risk and insurance challenges, while regions experiencing extreme heat or cold encountered higher energy demand.
These expenses are difficult to avoid. Consumers can postpone buying furniture or taking a vacation, but it is harder to negotiate with August humidity, January wind, or an insurance renewal notice written in the emotional style of a ransom letter.
Service inflation proved persistent
Prices for medical care, personal care, recreation, home repair, education, and other services remained important. Services depend heavily on labor, and wage increases can pass into consumer prices. That does not mean workers caused inflation; it means a service-heavy economy has cost structures that adjust slowly.
What the Ranking Does and Does Not Tell Us
The ranking is useful for identifying where prices were accelerating at a specific point in 2025. It is less useful as a permanent verdict on affordability. Rankings changed as new CPI reports arrived. Seattle led one snapshot, while Boston, Baltimore, Denver, or other metros rose to the top in different updates.
The list also includes metropolitan areas rather than city limits. “Seattle,” for example, represents the broader Seattle-Tacoma-Bellevue region. Household experiences can vary significantly between an urban core, an outer suburb, and a neighboring county.
Finally, CPI reflects an average spending basket. A renter who commutes by car, a retired homeowner with medical expenses, and a young professional who eats out frequently will experience different personal inflation rateseven when they share the same ZIP code.
How Households Responded to Higher Prices
Consumers increasingly focused spending on necessities and searched more aggressively for discounts. Common adjustments included switching brands, using store loyalty programs, consolidating errands, eating at home, delaying vehicle replacements, choosing smaller apartments, or reducing entertainment spending.
These decisions can keep a budget balanced, but they also reveal why inflation feels worse than a single percentage suggests. Inflation does not merely increase a total. It changes routines, postpones plans, narrows choices, and turns ordinary shopping into an unwanted part-time research position.
Practical Experiences From Living With City Inflation
To understand inflation beyond a spreadsheet, consider an illustrative household living in one of the higher-ranked metros. The family has not made any dramatic lifestyle changes. It rents the same apartment, drives the same car, buys roughly the same groceries, and orders takeout once a week. Yet its checking-account balance begins disappearing earlier each month.
The first sign is usually food. A cart containing chicken, cereal, vegetables, milk, coffee, and household supplies costs several dollars more than expected. No single item looks financially catastrophic. The damage comes from ten small increases working together like a highly organized team of pickpockets.
The household responds by planning meals and comparing unit prices. Name-brand snacks quietly become store-brand snacks. Restaurant visits become takeout, takeout becomes frozen pizza, and frozen pizza becomes a debate about whether everyone would enjoy “breakfast for dinner” for the third time this week.
Next comes housing. A renter receives a renewal offer with a higher monthly payment. Moving might save money, but deposits, application fees, transportation, and time make relocation expensive. A prospective buyer runs the mortgage numbers and discovers that a home within budget last year now produces a payment that looks like a typographical error.
Transportation creates another layer. Gasoline prices may fluctuate, but insurance, maintenance, parking, tolls, and repairs rarely coordinate their increases politely. A routine brake job or tire replacement can erase months of careful grocery savings in one afternoon.
Then there are services. A haircut costs more. The veterinarian raises fees. A streaming platform announces another “small” increase. The electric bill spikes during an unusually hot month. Each company insists the adjustment is modest. Together, the adjustments form a committee dedicated to ruining Tuesday.
The most useful response is not extreme deprivation but deliberate prioritization. Households often begin by separating expenses into fixed obligations, flexible necessities, and optional purchases. They review recurring subscriptions, request new insurance quotes, schedule major purchases around sales, and create a small buffer for volatile categories such as utilities and food.
Tracking a personal basket can also be more helpful than obsessing over national inflation. A family might record the monthly cost of rent, groceries, transportation, insurance, child care, and medical expenses. This reveals which categories are actually driving its budget and where changes will have the greatest effect.
Another common lesson is that the cheapest choice is not always the most economical one. Driving across town to save a dollar on detergent wastes fuel and time. Buying low-quality shoes repeatedly may cost more than purchasing a durable pair. Inflation rewards comparison shopping, but it also rewards arithmetic.
Finally, households benefit from recognizing that frustration is reasonable. Slower inflation does not mean prices have returned to earlier levels. It means the speed of increase has moderated. People can therefore hear that inflation is “improving” while still feeling financially squeezed, and both statements may be true.
Conclusion
The 2025 city inflation picture was not a simple contest between expensive and affordable places. Seattle ranked first because of rapid short-term acceleration, while San Diego combined high annual inflation with an already elevated cost structure. Tampa, St. Louis, New York, Philadelphia, and Miami also experienced notable pressure.
At the other end, Phoenix and Dallas posted much slower inflation in this snapshot. Even there, however, residents continued paying price levels shaped by several years of cumulative increases.
The larger lesson is that local inflation depends on timing, housing conditions, energy markets, insurance costs, population trends, and household spending patterns. National statistics describe the weather across the country; metro data tell you whether you personally need an umbrella.
Note: The table represents one 2025 CPI-based ranking snapshot of 23 selected metropolitan areas. It measures changes in prices rather than absolute living costs, and rankings may differ when another month or reporting period is used.