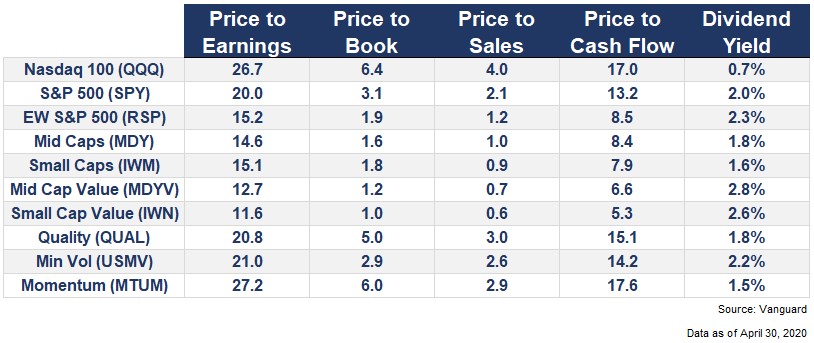
The stock market is expensive. There, we said it. Now comes the more difficult question: Does “expensive” mean investors should run for the exits, hide under a Treasury bill, and refuse to come out until stocks are on clearance?
Not necessarily.
As of July 2026, several widely followed market valuation indicators suggest that U.S. stocksespecially large-cap stocksare priced well above historical norms. The Shiller CAPE ratio is hovering near levels last associated with extreme optimism, the total market is enormous relative to the economy, and bond yields are high enough to compete seriously for investors’ dollars. At the same time, corporate earnings are growing quickly, profit margins remain unusually strong, and the economy is still expanding.
In other words, the market looks overvalued, but it does not look obviously irrational. It is wearing an expensive suit, yet it may actually have a decent job.
What Does “Overvalued” Actually Mean?
A stock market is considered overvalued when share prices appear high relative to the income, cash flow, assets, or economic output supporting those prices. However, valuation is not an objective speed limit. There is no market police officer waiting to issue the S&P 500 a ticket for trading at 20 times earnings.
Valuation measures are better understood as tools for estimating future returns and risk. When investors pay unusually high prices, they are accepting lower earnings yields today and placing greater faith in future growth. That arrangement can work beautifully when profits exceed expectations. It becomes less charming when growth merely arrives on timeor forgets to arrive at all.
The Price-to-Earnings Ratio
The price-to-earnings ratio, or P/E ratio, compares a stock’s price with its earnings per share. For the entire market, it shows how much investors are willing to pay for each dollar of corporate profit.
FactSet reported that the S&P 500’s forward 12-month P/E ratio stood at approximately 20.3 in mid-July 2026. That was above its five-year average of 19.9 and its 10-year average of 19.0. The trailing P/E ratio was even richer because it used already-reported earnings rather than optimistic forecasts about tomorrow.
A forward P/E of 20.3 translates into an earnings yield of roughly 4.9%. That is not disastrous, but it becomes less impressive when a relatively safe 10-year Treasury bond yields around 4.6%. Stocks offer growth and dividends, of course, but they also come with recessions, disappointing earnings, executive blunders, and the occasional company that decides artificial intelligence should be mentioned 73 times during an earnings call.
The Shiller CAPE Ratio
The Shiller CAPE ratio attempts to smooth out economic cycles by comparing stock prices with 10 years of inflation-adjusted earnings. Because it does not depend entirely on one unusually strong or weak year, it can provide a broader view of market valuation.
In July 2026, the CAPE ratio was around 40.6. That placed it among the highest readings in the historical series and not far below the extremes reached during the dot-com era. The message is not that a crash must happen next Tuesday at 2:17 p.m. The message is that investors are paying an unusually large amount for normalized corporate earnings.
CAPE has limitations. Accounting standards change, companies buy back more shares, and today’s index contains more scalable, asset-light businesses than it did decades ago. Still, dismissing CAPE entirely because it is imperfect would be like throwing away a smoke detector because it cannot tell you which curtain is on fire.
The Buffett Indicator
The Buffett Indicator compares the total value of publicly traded U.S. companies with gross domestic product. As of March 31, 2026, the ratio was estimated at 219%, with total market value of about $69.15 trillion compared with annualized GDP of $31.57 trillion. That was approximately 2.1 standard deviations above the indicator’s historical trend and was classified as strongly overvalued.
This indicator also has weaknesses. Large U.S. corporations earn significant revenue abroad, while GDP measures domestic economic activity. Modern businesses may also deserve higher valuations because of strong margins, recurring revenue, intellectual property, and global reach. Nevertheless, a market worth more than twice annual economic output deserves at least a raised eyebrow.
The Equity Risk Premium
The equity risk premium measures the additional return investors expect from stocks over relatively safe government bonds. NYU professor Aswath Damodaran estimated an implied U.S. equity risk premium of about 4.18% on July 1, 2026. That still represents compensation for stock-market risk, but high interest rates and elevated stock prices leave less room for disappointment than investors enjoyed at more attractive entry points.
Why the Market May Be Overvalued
Prices Have Outrun Normal Valuation Ranges
Multiple independent measures are flashing similar signals. Forward earnings multiples are above recent averages. CAPE is historically elevated. The Buffett Indicator is deep into overvalued territory. None of these metrics can predict a near-term decline, but together they suggest that much of the good news has already been priced into U.S. equities.
That matters because high starting valuations have historically been associated with lower long-term returns. Investors can still make money, sometimes a great deal of it, but more of the return must come from actual earnings growth rather than from other investors agreeing to pay an even higher multiple.
Interest Rates Are No Longer Giving Stocks a Free Pass
During periods when government bonds yield almost nothing, investors have powerful incentives to accept expensive stock valuations. A dividend-paying company looks attractive when the alternative is a savings account offering enough interest to buy one decorative coffee bean.
The situation is different in 2026. The Federal Reserve maintained a federal funds target range of 3.5% to 3.75% at its June meeting, while the 10-year Treasury yield reached approximately 4.6% in July. Those yields provide real competition for equities and increase the discount rate used to value future corporate cash flows.
Higher discount rates are particularly important for growth stocks whose expected profits sit far in the future. A dollar earned 10 years from now is worth less today when investors can earn a respectable return from government bonds while waiting.
Market Concentration Raises the Stakes
S&P Dow Jones Indices reported that the 10 largest S&P 500 companies represented almost 40% of the index by mid-2025, a concentration level not seen since the mid-1960s. That means a relatively small group of mega-cap businesses can have an unusually large effect on the performance and valuation of the entire index.
Concentration is not automatically bearish. Market-cap-weighted indexes naturally increase their exposure to successful companies. The problem appears when investors mistake dominant companies for invincible companies. Great businesses can still become poor investments when purchased at prices that require flawless execution.
Why Today’s Valuation May Be Justified
Corporate Earnings Are Growing Rapidly
The bullish case begins with a simple fact: Companies are making a lot of money.
FactSet estimated year-over-year S&P 500 earnings growth of approximately 24.7% for the second quarter of 2026 and projected full-year earnings growth of about 24.5%. Early in the reporting season, 88% of companies that had announced results exceeded earnings estimates, and reported earnings were collectively well above analysts’ forecasts.
Strong earnings can reduce valuation ratios even when stock prices remain flat or continue rising moderately. A market trading at 20 times earnings today may become less expensive next year if profits expand rapidly enough. This is the central argument against declaring the market a bubble based only on price charts.
Profit Margins Are Exceptionally Strong
Estimated S&P 500 net profit margins for the second quarter of 2026 were around 14.2%. If confirmed, that would be the second-highest quarterly margin since FactSet began tracking the metric in 2009, behind the previous quarter’s 14.8% record. Information technology margins were especially strong.
These margins help explain why older valuation comparisons can be misleading. A company that turns 14 cents of every revenue dollar into profit may reasonably deserve a higher valuation than one earning only 8 or 9 cents. The uncomfortable question is whether those margins are sustainable after wages, energy prices, tariffs, competition, taxes, and enormous AI infrastructure spending have finished sending their invoices.
The Economy Is Still Expanding
Real U.S. GDP grew at an annualized rate of 2.1% in the first quarter of 2026, while corporate profits from current production increased by $74.4 billion. Economic growth was not spectacular, but it was positive and accompanied by continued profitability.
Inflation also showed signs of cooling in June. The Consumer Price Index declined 0.4% from the previous month, although it remained 3.5% higher than a year earlier. Lower inflation could eventually reduce pressure on interest rates, but the annual rate was still above the Federal Reserve’s 2% objective.
Artificial Intelligence Could Lift Productivity
Current valuations partly assume that artificial intelligence will improve productivity, lower operating costs, create new revenue streams, and expand corporate profits. That assumption is not pure science fiction. Businesses are already spending heavily on data centers, chips, software, power infrastructure, and automation.
Goldman Sachs raised its year-end 2026 S&P 500 forecast to 8,000 and projected S&P 500 earnings per share of $340 for 2026, representing approximately 24% annual growth. Its bullish view depends heavily on continued earnings strength rather than an endless expansion of valuation multiples.
The risk is that AI spending may produce returns more slowly than investors expect. The internet changed the world, but it did not prevent countless internet stocks from collapsing. A revolutionary technology and an overvalued investment can occupy the same conference room.
Is This Another Stock-Market Bubble?
The word “bubble” is emotionally satisfying but analytically slippery. It usually describes prices that have become detached from reasonable expectations of future cash flow, often because investors believe traditional valuation rules no longer apply.
Today’s market contains bubble-like features: high valuation multiples, enthusiasm surrounding a transformative technology, heavy index concentration, and optimistic long-term assumptions. However, many market leaders also generate substantial revenue, free cash flow, and profit. That makes the current environment different from periods when companies with little more than a domain name and an office fern received billion-dollar valuations.
A reasonable conclusion is that the broad U.S. market is overvalued, while only certain areas may qualify as speculative bubbles. Valuations differ dramatically by sector. FactSet reported forward P/E ratios of approximately 25.9 for consumer discretionary stocks and 25.2 for industrials, compared with 13.4 for energy and 15.5 for financial companies. The “stock market” is not one giant stock wearing 500 name tags.
What Overvaluation Means for Investors
Expect More Modest Long-Term Returns
High valuations do not guarantee negative returns, but they make historically exceptional returns harder to repeat. Schwab estimates that U.S. large-cap equities may return about 5.9% annually over the next decade, compared with 7% for developed international large-cap stocks and 4.8% for U.S. aggregate bonds. J.P. Morgan projects a 6.7% long-term return for U.S. large-cap stocks and 7% for global equities.
Morningstar’s review of major asset managers found similarly restrained forecasts. BlackRock expected roughly 5.2% annual returns from U.S. equities over 10 years, while Fidelity cited elevated valuations as a major constraint on future U.S. stock returns. These are forecasts, not promises, but they illustrate a broad point: Investors should not automatically assume that the next decade will resemble the strongest years of the last decade.
Diversification Matters More at High Valuations
Investors concerned about S&P 500 valuation do not have to choose between owning the most expensive mega-cap stocks and storing cash beneath a mattress guarded by an unusually judgmental cat.
Potential diversification options include international equities, small- and mid-cap stocks, value-oriented companies, bonds, Treasury inflation-protected securities, real estate investment trusts, and cash reserves. These assets introduce their own risks, but they reduce dependence on one narrow group of expensive U.S. companies.
Rebalancing Is More Reliable Than Market Timing
An investor whose stock allocation has grown far beyond its intended target can rebalance by directing new contributions toward bonds, international stocks, or other underrepresented assets. This trims risk without requiring a heroic prediction about the exact market peak.
Trying to sell everything because the market appears expensive creates a second problem: deciding when to return. Markets can remain overvalued for years, and major gains often occur while cautious investors are still waiting for prices to become “reasonable.” The market has never mailed anyone a polite invitation announcing that the bottom is now available.
Investor Experiences and Practical Lessons from Expensive Markets
The most useful experiences surrounding overvalued markets are rarely stories about someone predicting the exact top. They are usually stories about what happened after an investor became too confident, too frightened, or too concentrated.
Experience One: Expensive Markets Can Become More Expensive
A common mistake is assuming that an overvalued market must immediately fall. An investor sees an elevated P/E ratio, sells a diversified portfolio, and waits proudly for the correction. The market then rises another 15%, earnings grow, and the investor faces the unpleasant task of buying back at a higher price.
The lesson is that valuation is more useful for setting return expectations than for selecting a specific selling date. It can tell investors that risk is elevated and future returns may be lower. It cannot reliably announce whether the correction begins tomorrow or three years from now.
Experience Two: Concentration Feels Safest Near the Top
During a powerful bull market, the winning companies often appear to be the only sensible investments. Their earnings are growing, their products dominate headlines, and every portfolio manager on television seems eager to explain why the old valuation rules have retired to Florida.
An investor may gradually sell slower-moving holdings and pour more money into recent winners. The portfolio looks brilliant until leadership changes. Even when the favored companies remain profitable, a decline in their valuation multiples can produce painful losses.
The practical lesson is not to avoid successful companies. It is to avoid allowing admiration for a business to erase discipline about position size and purchase price.
Experience Three: Dollar-Cost Averaging Reduces Emotional Pressure
Investors with a large amount of cash often feel trapped when valuations are high. Investing everything at once may feel reckless, while holding everything in cash creates the fear of missing another rally.
One practical compromise is to invest according to a predetermined schedule. Funds might be deployed monthly or quarterly across a diversified portfolio. Dollar-cost averaging cannot guarantee a better return than immediate investment, but it can reduce the temptation to make an all-or-nothing decision based on one valuation reading.
The emotional benefit matters. A plan established in advance is less likely to be abandoned because of an alarming headline, an exciting earnings report, or a social-media expert whose profile picture features three sports cars and no audited performance record.
Experience Four: Rebalancing Often Beats Prediction
Suppose an investor intended to hold 60% in stocks and 40% in bonds. After a powerful equity rally, the portfolio shifts to 72% stocks and 28% bonds. The investor does not need to decide whether the market is officially a bubble. Rebalancing toward the original allocation automatically sells some appreciated assets and purchases relatively cheaper ones.
This approach can feel boring, which is one of its greatest strengths. Boring plans tend to survive. Exciting plans often become expensive stories told over dinner.
Experience Five: A Good Company Is Not Always a Good Buy
Investors frequently confuse business quality with investment value. A company may have a powerful brand, excellent management, rising revenue, and industry-leading margins. None of those qualities establishes an unlimited fair price.
When expectations are extremely high, a company can exceed last year’s earnings and still disappoint the market. Its shares may fall simply because growth was excellent rather than miraculous. The experience teaches investors to ask two separate questions: “Is this a great business?” and “What assumptions are already included in its share price?”
Experience Six: The Best Strategy Is One You Can Continue
A market downturn is not merely a mathematical event. It is an emotional test. Investors who take excessive risk during rising markets may discover that their true tolerance is much lower when account balances start falling.
A sustainable portfolio should allow an investor to continue contributing, rebalancing, and sleeping normally through periods of volatility. The ideal allocation is not the one that produces the highest theoretical return in a spreadsheet. It is the one the investor can maintain when the spreadsheet begins screaming.
So, Is the Stock Market Overvalued?
Yesbased on several major valuation measures, the U.S. stock market is overvalued relative to historical norms. The S&P 500’s forward P/E ratio is elevated, the Shiller CAPE ratio is near historical extremes, the Buffett Indicator is deeply stretched, and Treasury yields offer meaningful competition for investor capital.
However, overvalued does not automatically mean doomed. Earnings growth is strong, corporate profit margins are unusually high, economic output is expanding, and AI-related investment may improve productivity. Those fundamentals provide a stronger foundation than existed during some previous speculative episodes.
The most defensible conclusion is that investors are paying premium prices for premium expectations. That creates vulnerability if earnings weaken, interest rates rise, profit margins contract, or enthusiasm surrounding AI cools. It also leaves room for additional gains if companies continue delivering exceptional results.
Rather than attempting to predict the precise market top, investors can respond by moderating return expectations, maintaining diversification, rebalancing oversized positions, avoiding excessive leverage, and continuing to invest according to a disciplined long-term plan. Valuation should influence how much risk an investor takesnot convince anyone that a crystal ball has suddenly appeared in the brokerage app.